基于不同显示设备的观察者同色异谱差异研究  下载: 1392次
Discrimination of Observer Metamerism Based on Different Display Devices
北京印刷学院印刷与包装工程学院, 北京 102600
图 & 表
图 1. 显示设备三原色的光谱能量分布。(a)红通道;(b)绿通道;(c)蓝通道
Fig. 1. Spectral power distributions of three primaries of display devices. (a) Red channel; (b) green channel; (c) blue channel
下载图片 查看原文
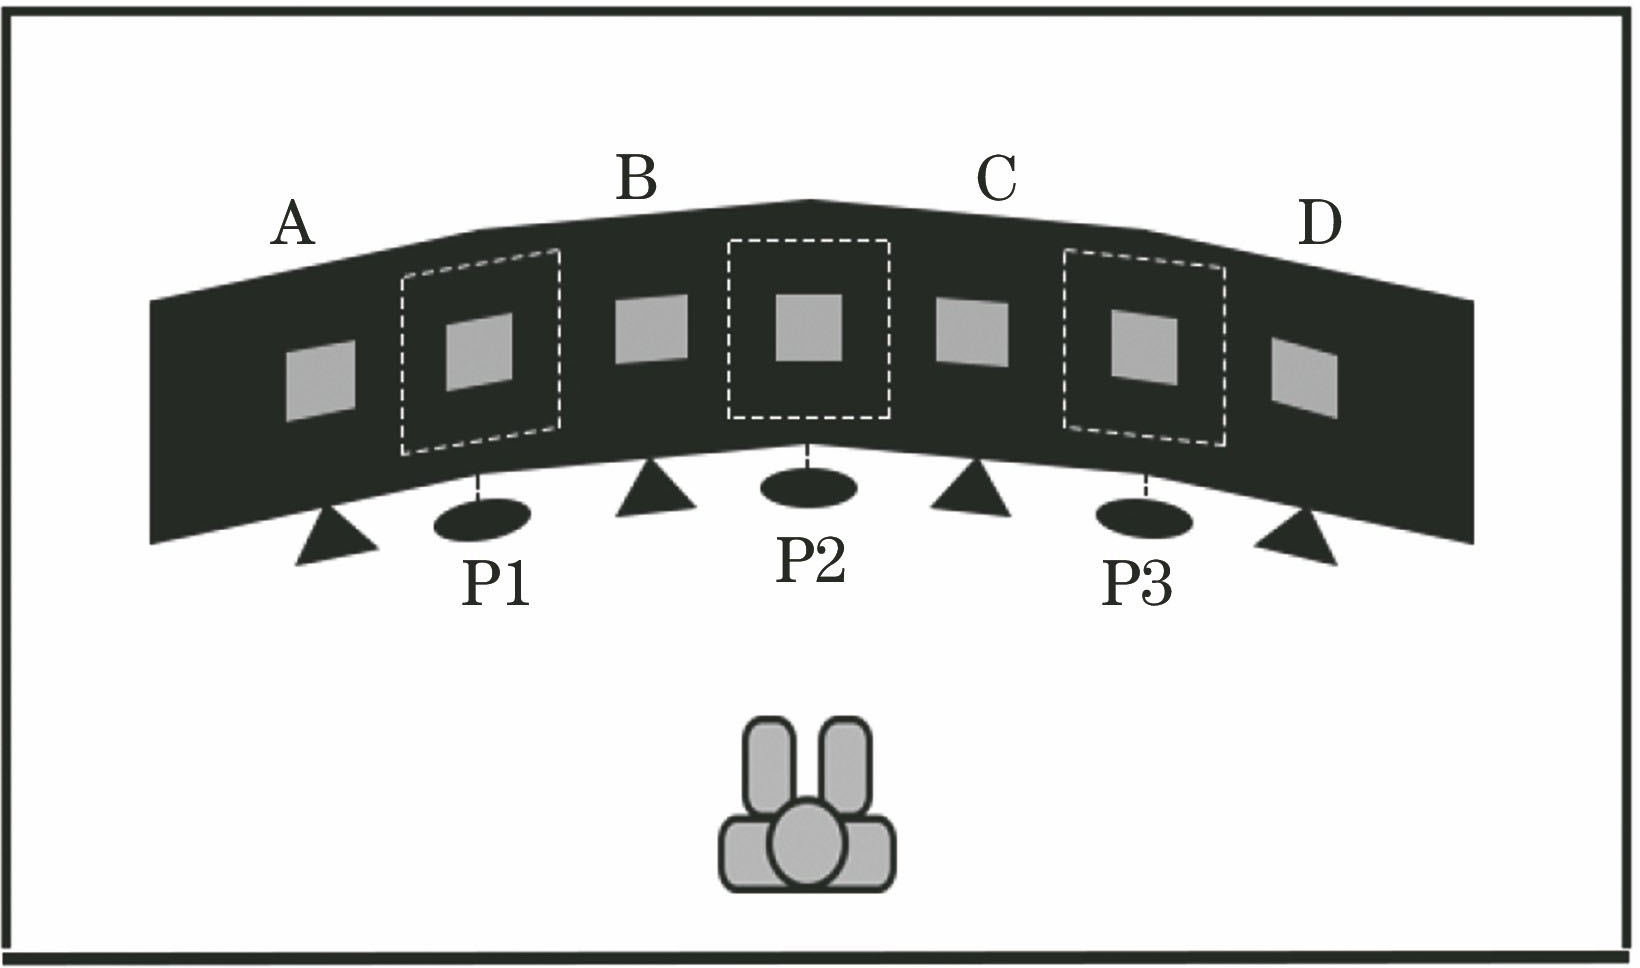
图 2. 颜色匹配实验装置
Fig. 2. Color-matching experimental setup
下载图片 查看原文
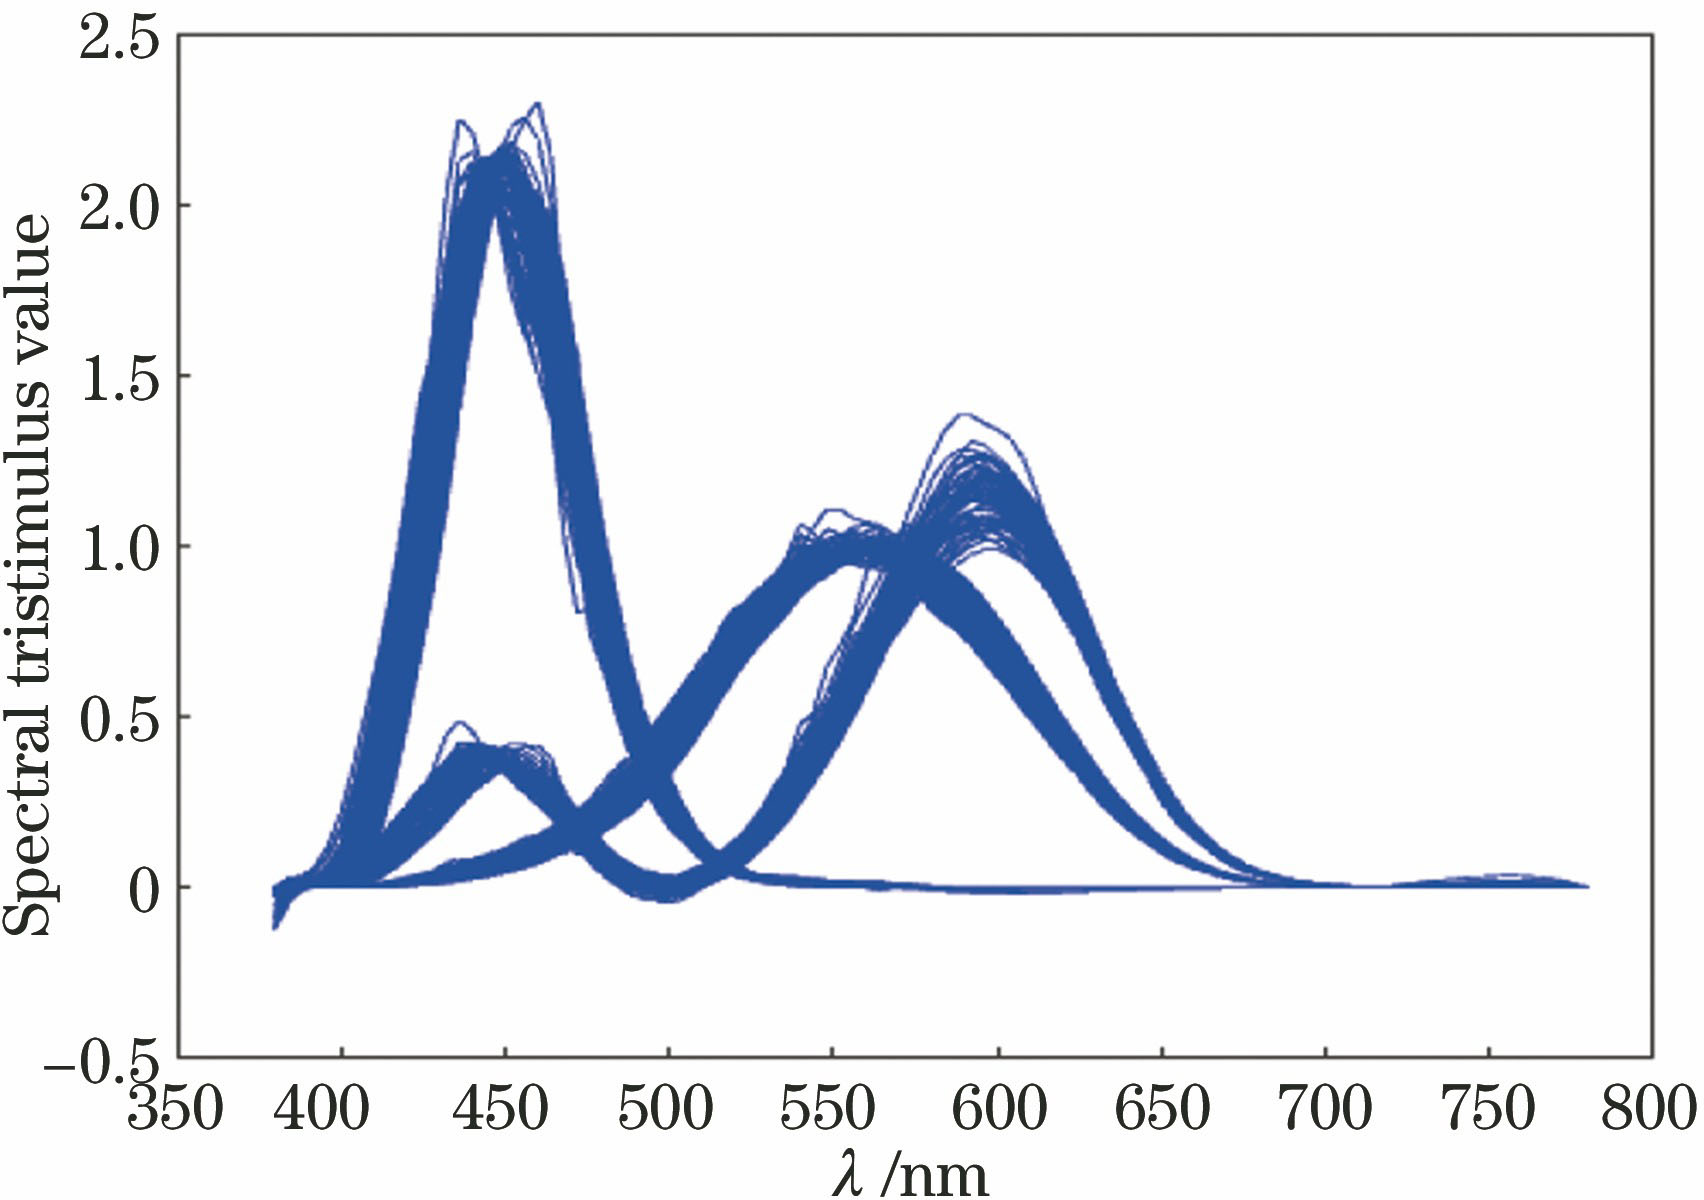
图 3. 108个颜色匹配函数的光谱响应曲线
Fig. 3. Spectral response curves of 108 color-matching functions
下载图片 查看原文
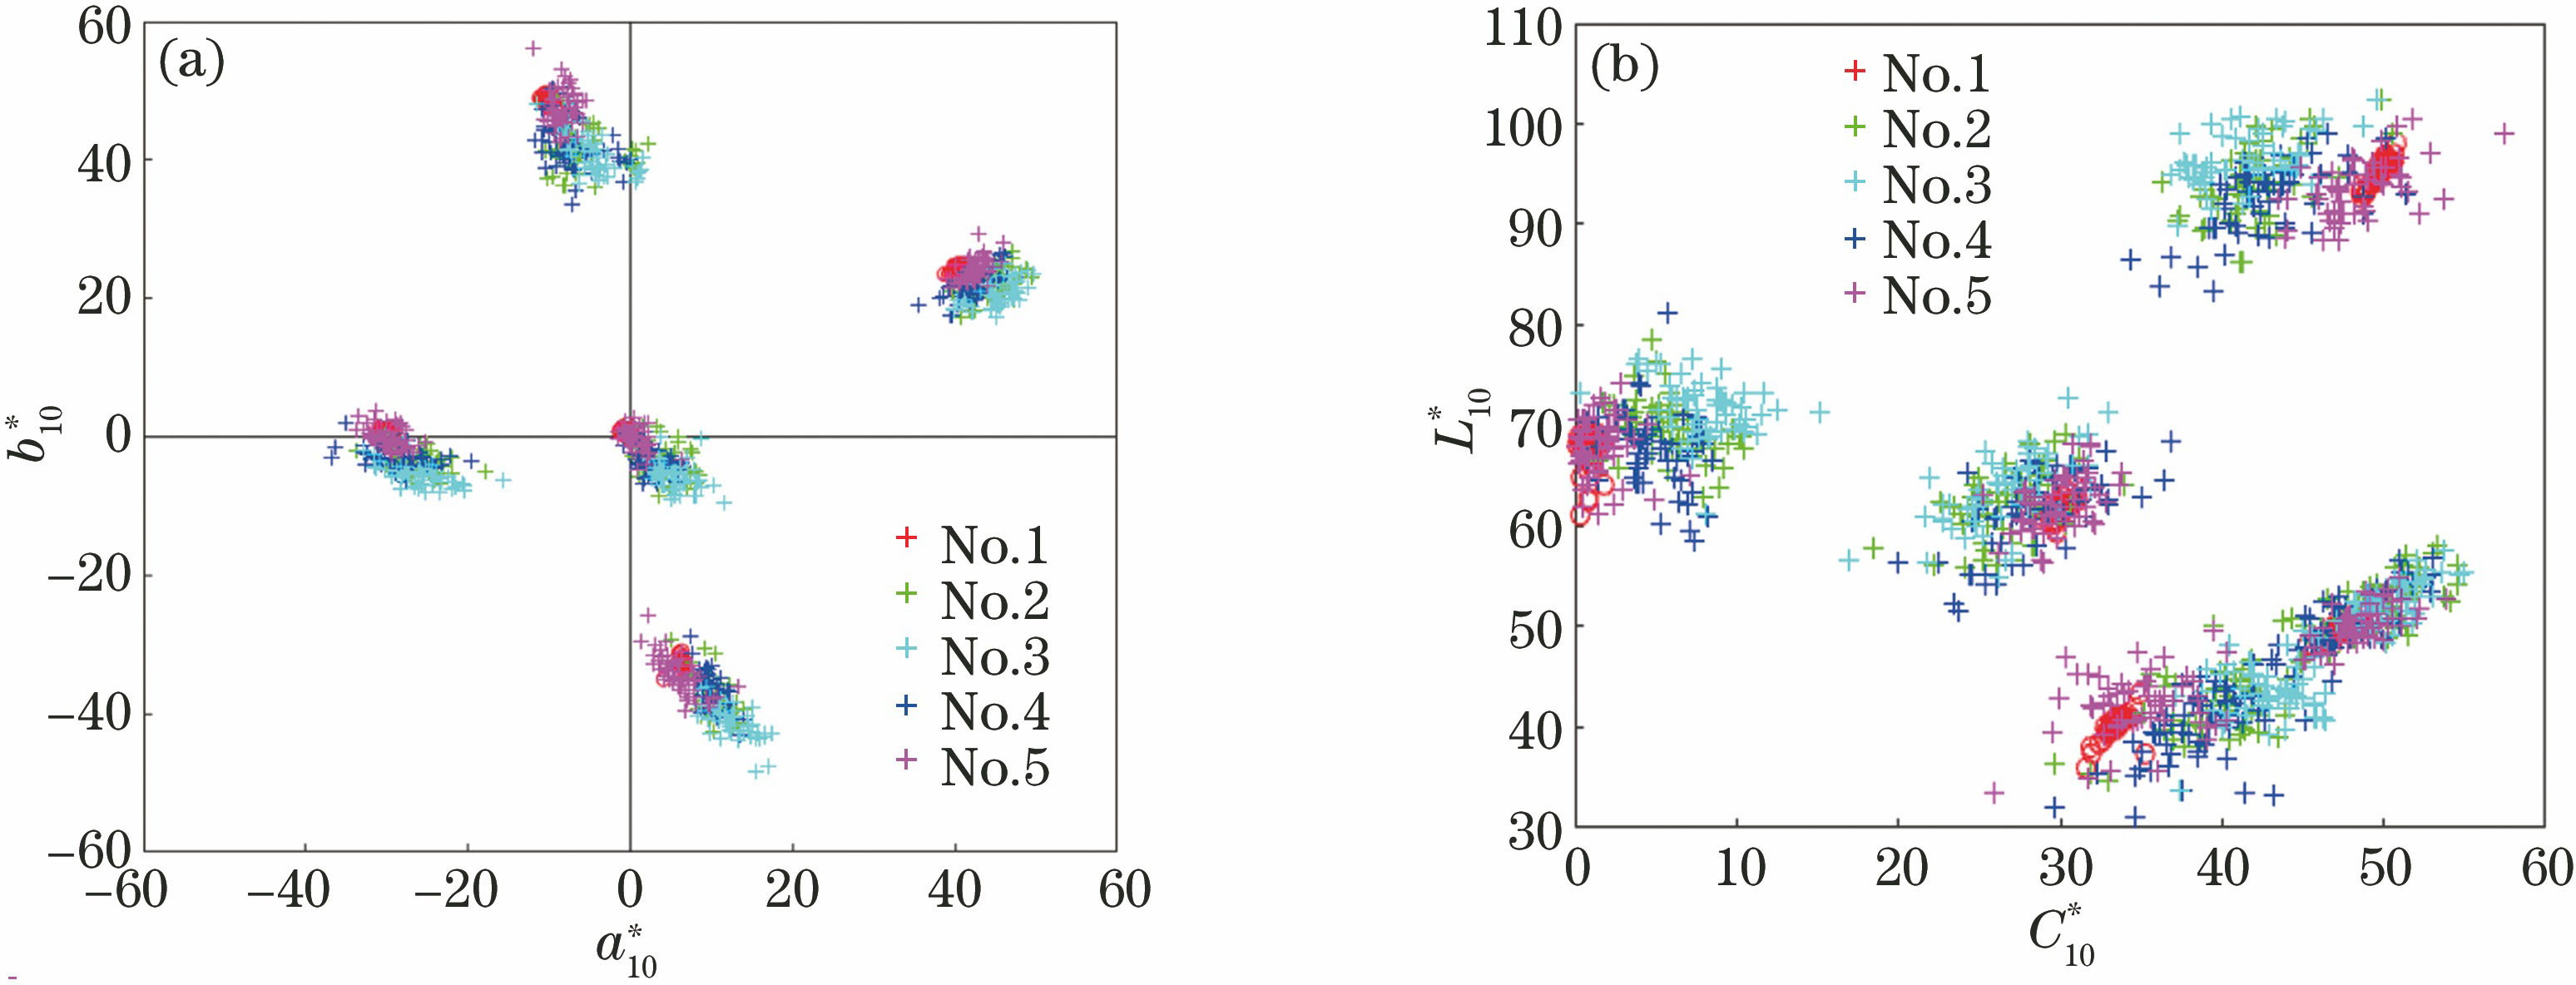
图 4. 基于不同显示设备模拟计算得到的匹配数据散点分布。(a) a10*b10*平面; (b) L10*C10*平面
Fig. 4. Scattering distributions of matched data obtained by simulation based on different display devices. (a) a10*b10*plane; (b) L10*C10* plane
下载图片 查看原文
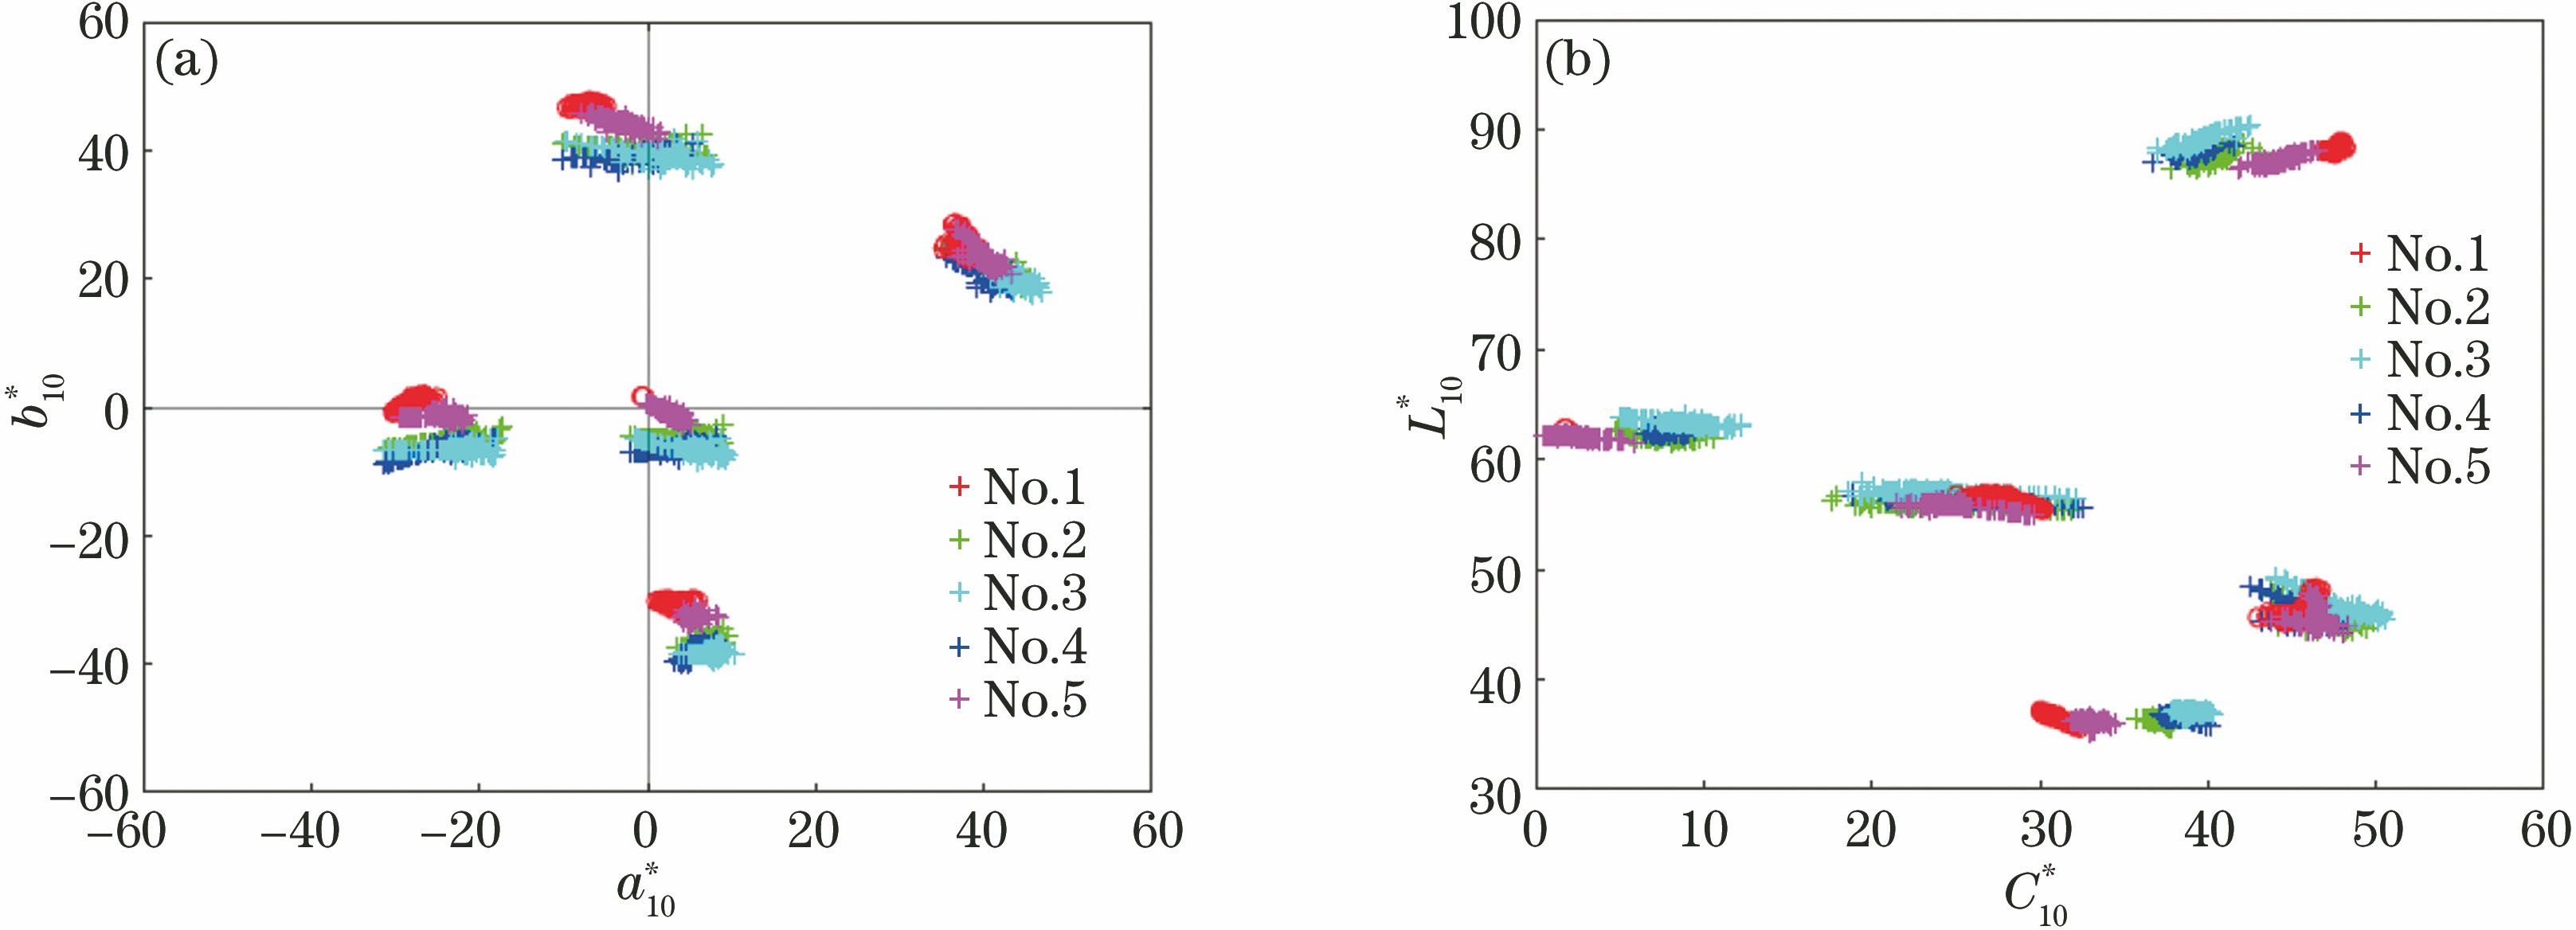
图 5. 基于不同显示设备的颜色匹配实验所得的匹配数据散点分布。 (a) a10*b10*平面;(b) L10*C10*平面
Fig. 5. Scattering distributions of matched data obtained from color-matching experiment based on different display devices. (a) a10*b10*plane; (b) L10*C10* plane
下载图片 查看原文
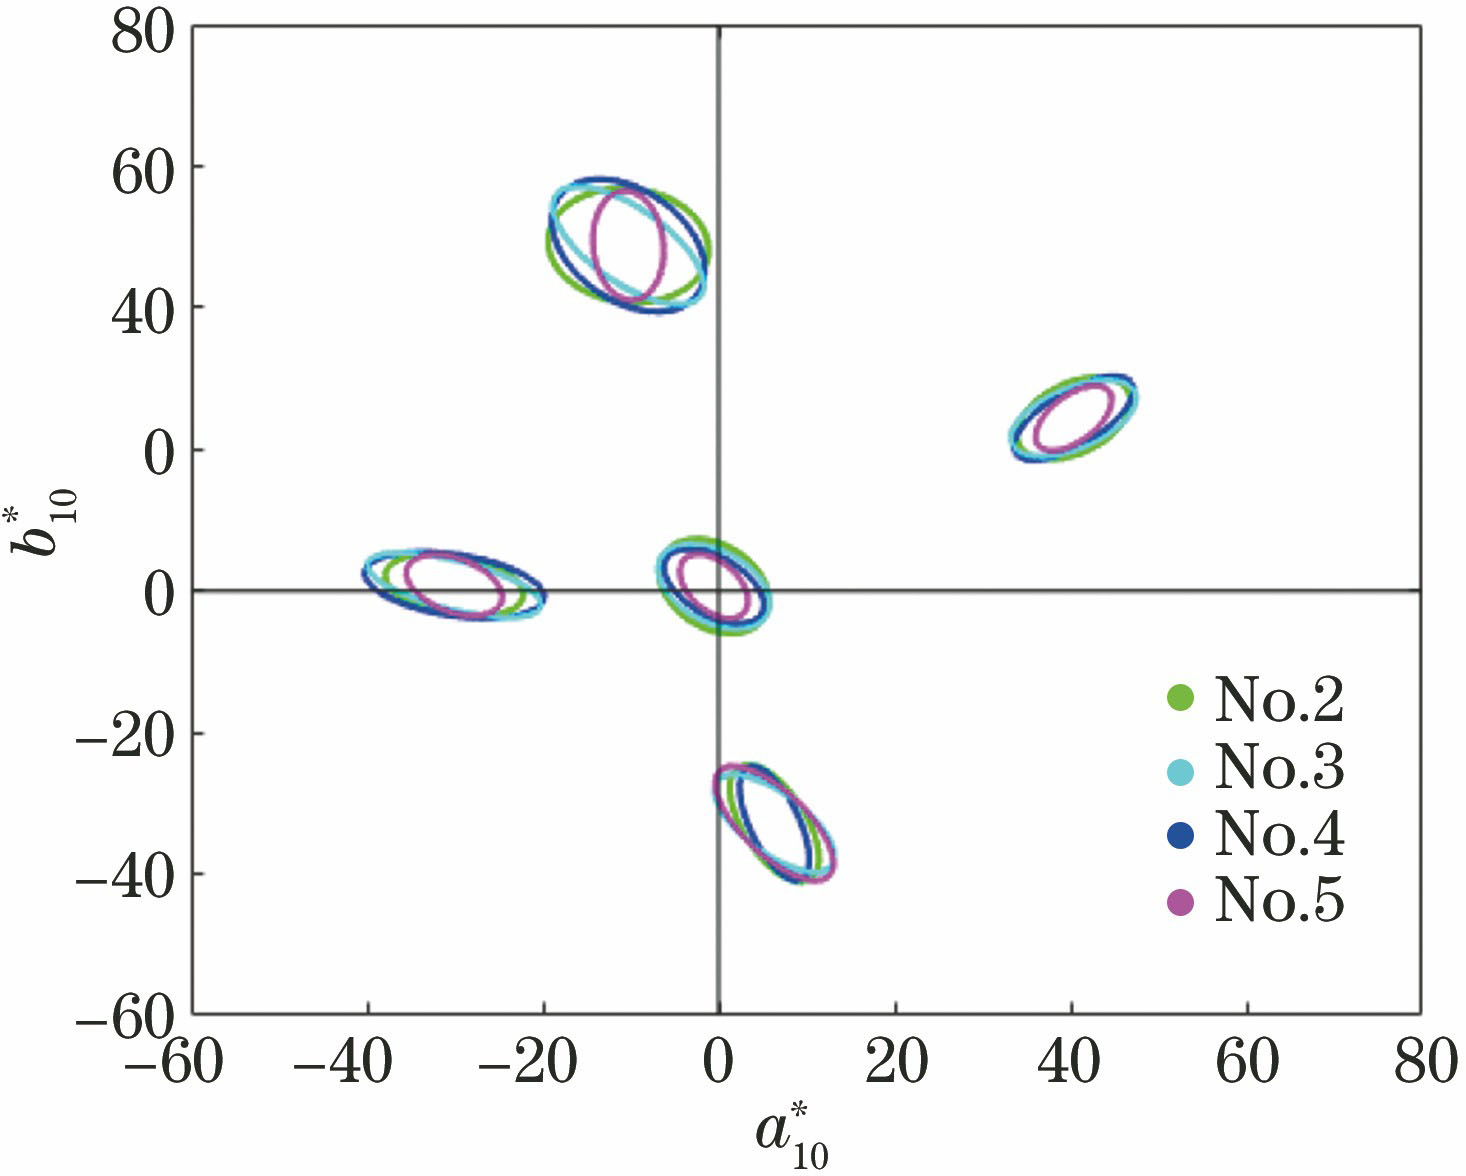
图 6. 不同显示设备的观察者的色度椭圆
Fig. 6. Colorimetric ellipses of observers based on different display devices
下载图片 查看原文
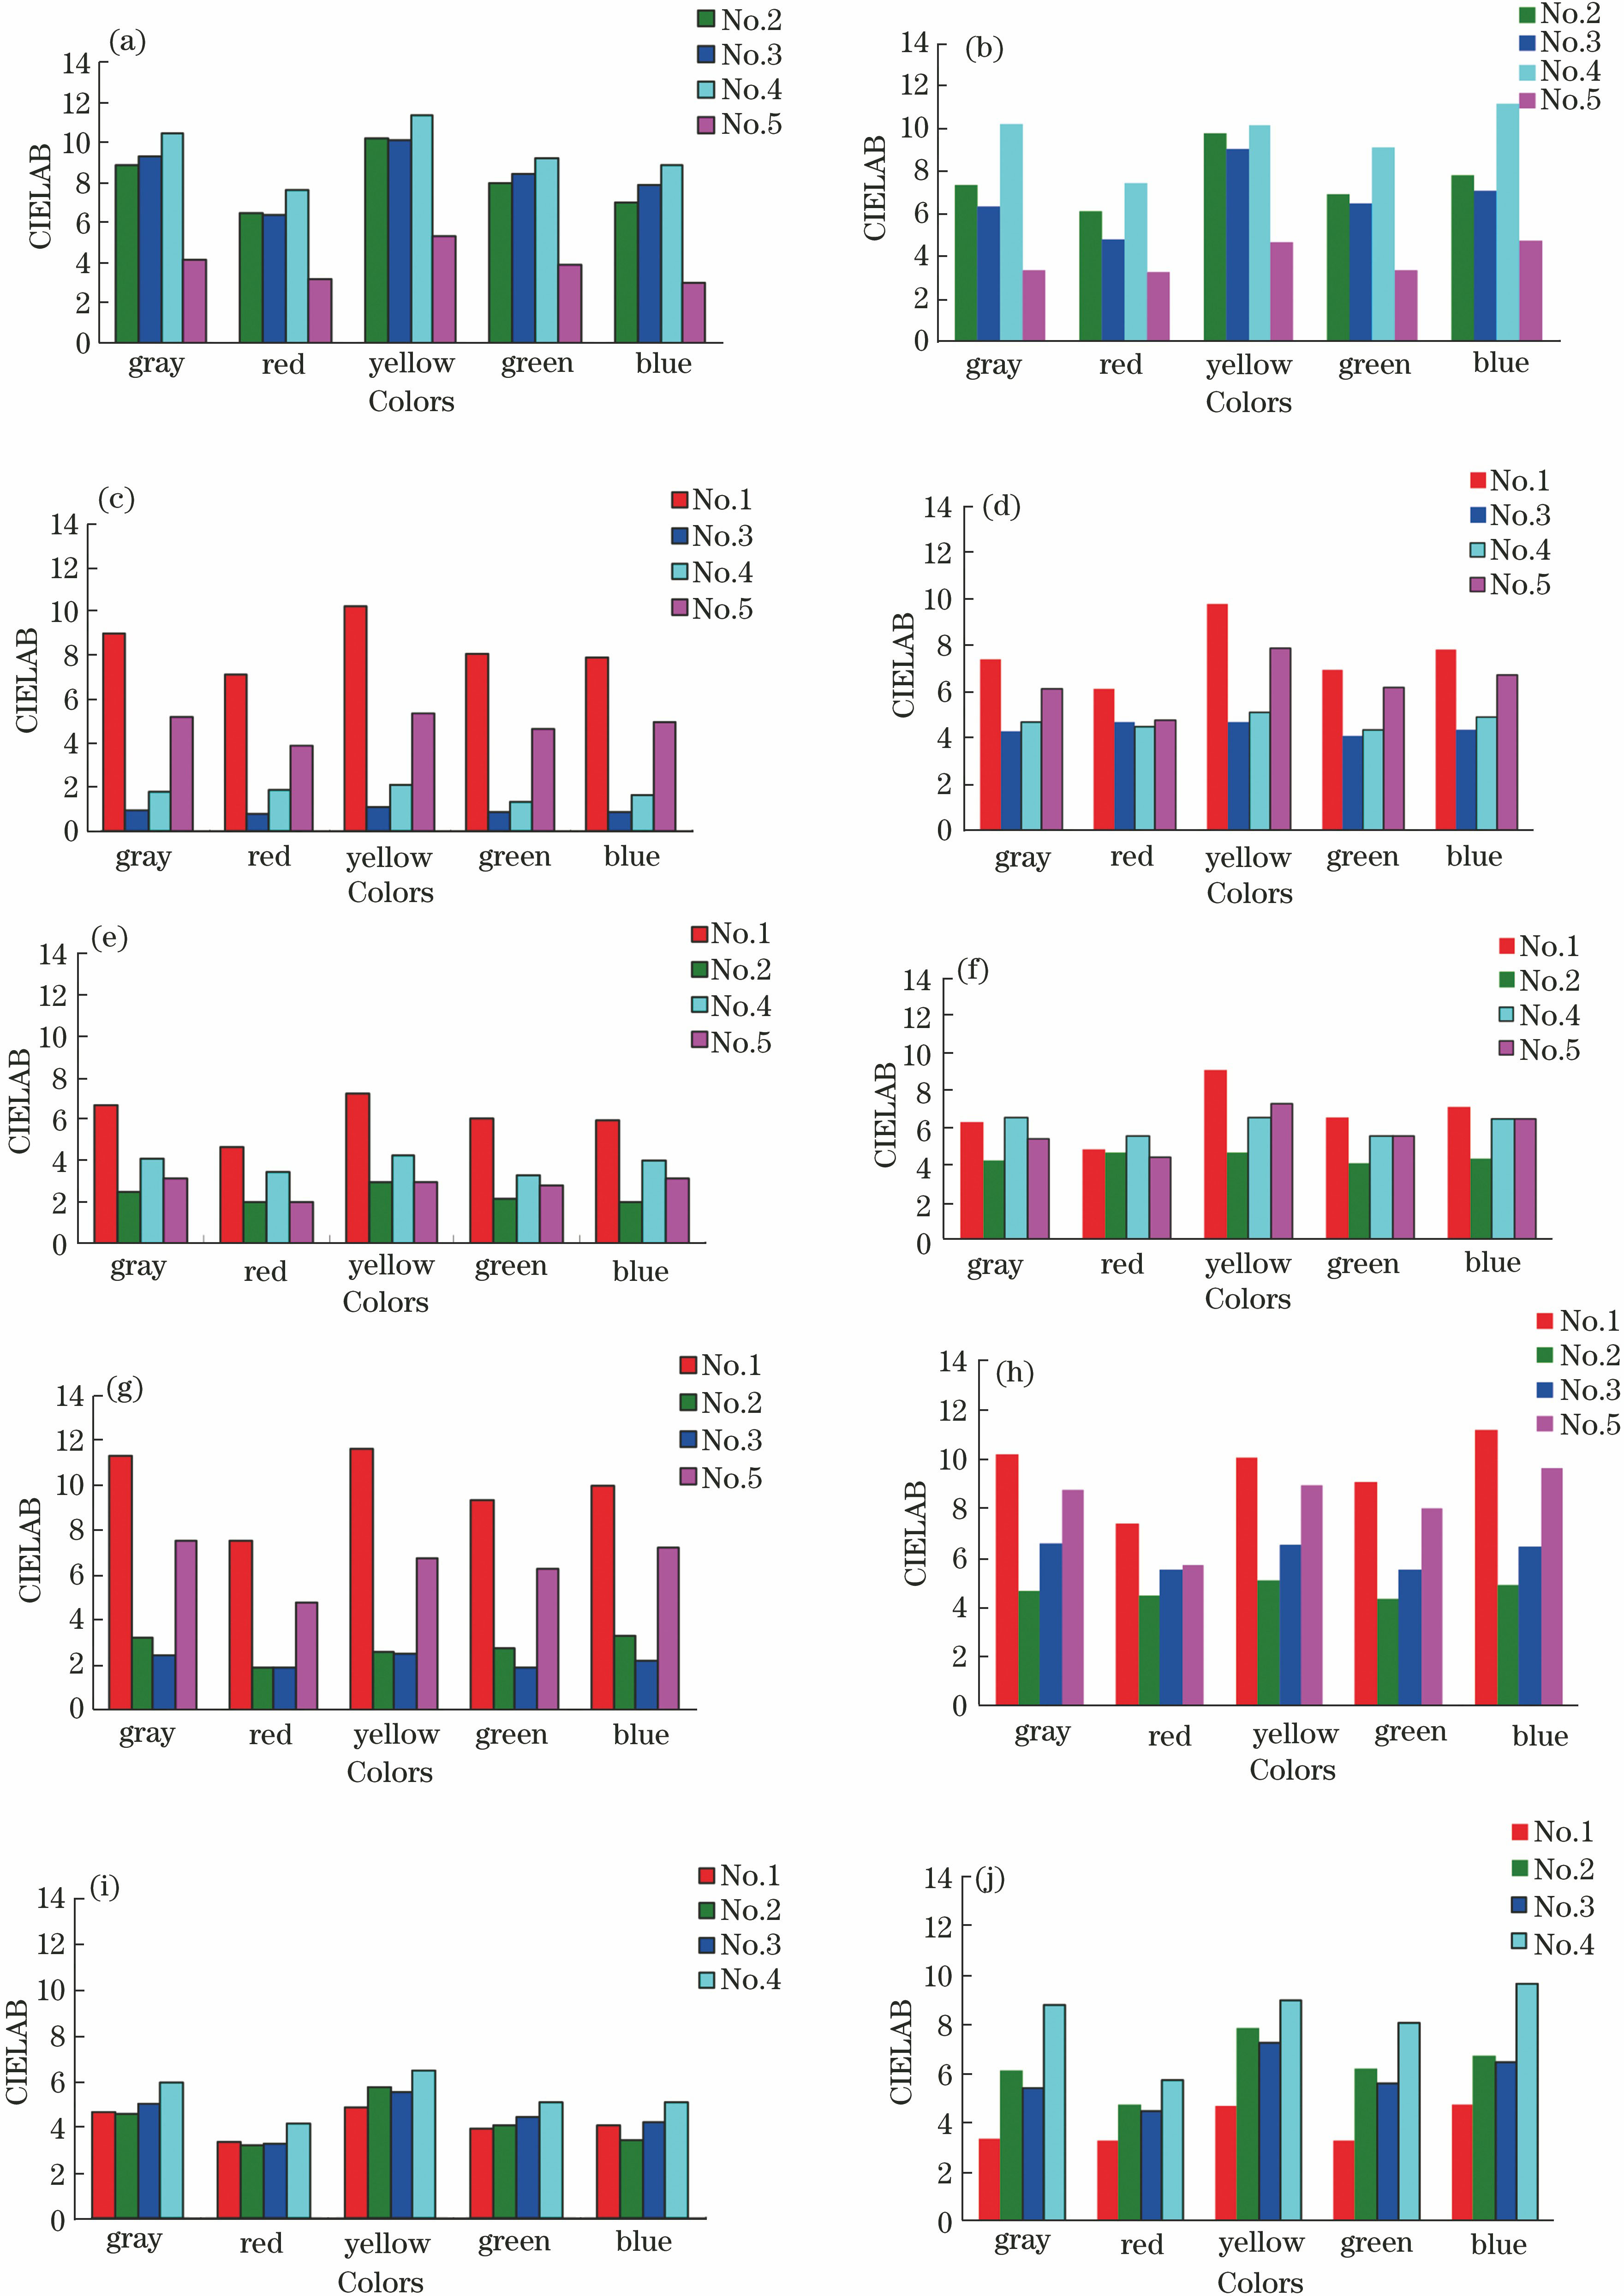
图 7. 不同显示设备和目标设备的(a)(c)(e)(g)(i)模拟计算结果和(b)(d)(f)(h)(j)颜色匹配实验结果(不同颜色中心)
Fig. 7. (a)(c)(e)(g)(i) Simulation results and (b)(d)(f)(h)(j) color-matching experimental results based on different display devices and target device (different color stimuli)
下载图片 查看原文
表 1显示设备的具体参数
Table1. Specific parameters of display devices
| No. | Display | Luminance /(cd·) | Correlated colour temperature /K | Tristimulus value (white points) | Resolution /(pixel×pixel) |
|---|
| Xn | Yn | Zn |
|---|
| 1 | IPAD | 119.58 | 5038 | 116.31 | 117.58 | 105.69 | 2048×1536 | | 2 | NEC-PA241W | 121.73 | 4996 | 112.14 | 119.05 | 93.33 | 1920×1200 | | 3 | NEC-PA242W | 120.38 | 5012 | 114.81 | 120.28 | 94.89 | 1920×1200 | | 4 | QUATO-220ex | 119.56 | 5053 | 109.25 | 117.24 | 88.89 | 1920×1080 | | 5 | EIZO-CG19 | 121.49 | 4989 | 112.77 | 117.01 | 99.45 | 1280×1024 |
|
查看原文
表 2各显示设备的三原色色品坐标
Table2. Chromaticity coordinates of three primaries of display devices
| Channel | IPAD | | NEC-PA241W | | NEC-PA242W | | QUATO-220ex | | EIZO-CG19 |
|---|
| x | y | | x | | y | x | y | x | y | x | y |
|---|
| R | 0.64 | 0.33 | | 0.6 | 0.34 | | 0.64 | 0.33 | | 0.66 | 0.33 | | 0.65 | 0.34 | | G | 0.35 | 0.57 | | 0.25 | 0.68 | | 0.26 | 0.68 | | 0.24 | 0.67 | | 0.33 | 0.61 | | B | 0.15 | 0.08 | | 0.15 | 0.13 | | 0.16 | 0.10 | | 0.14 | 0.09 | | 0.14 | 0.13 | | W | 0.34 | 0.35 | | 0.34 | 0.37 | | 0.35 | 0.37 | | 0.35 | 0.37 | | 0.34 | 0.35 |
|
查看原文
表 3目标设备显示颜色和CIE推荐颜色的色度值
Table3. Colorimetric values of CIE-recommended colors and colors from target display device
| Color | CIE-recommended colors | | Target colors | Δ |
|---|
| | | | | | | | | | | |
|---|
| Gray | 62 | 0 | 0 | 0 | 0 | | 63.0 | -0.5 | 0.6 | 0.8 | 127.0 | 1.3 | | Red | 44 | 37 | 23 | 43.6 | 31.9 | | 45.9 | 37.7 | 23.3 | 44.3 | 31.7 | 2.0 | | Yellow | 87 | -7 | 47 | 47.5 | 98.4 | | 88.6 | -6.9 | 46.3 | 46.8 | 98.4 | 1.8 | | Green | 56 | -32 | 0 | 32.0 | 180.0 | | 57.0 | -27.1 | 0.7 | 27.1 | 178.5 | 5.0 | | Blue | 36 | 5 | -31 | 31.4 | 279.1 | | 37.1 | 3.1 | -31.1 | 31.2 | 275.7 | 2.2 |
|
查看原文
表 4不同显示设备的观察者同色异谱指标
Table4. Indexes of observer metamerism based on different display devices
| Condition | No.1 | | No.2 | | No.3 | No.4 and No.5 |
|---|
| No.2 | | No.3 | No.4 | No.5 | No.3 | No.4 | No.5 | No.4 | No.5 |
|---|
| Simulation | | 8.10 | 8.42 | 9.50 | 3.91 | | 0.91 | 1.74 | 4.81 | | 3.85 | 2.82 | 6.55 | | OMmax | 14.56 | 12.77 | 16.00 | 9.21 | | 2.75 | 3.67 | 9.00 | | 7.12 | 6.38 | 9.45 | | Experiment | | 7.61 | 6.76 | 9.59 | 3.89 | | 4.41 | 4.71 | 6.33 | | 6.13 | 5.85 | 8.22 | | OMmax | 15.32 | 18.98 | 20.73 | 11.08 | | 12.83 | 14.41 | 15.16 | | 14.24 | 19.52 | 15.11 |
|
查看原文
表 5不同显示设备红绿蓝通道的峰值波长位置
Table5. Peak wavelength positions of R/G/B channels of different display devices
| Channel | Peak wavelength position /nm |
|---|
| No.1 | No.2 | No.3 | No.4 | No.5 |
|---|
| R | 616 | 660 | 652 | 620 | 612 | | G | 548 | 516 | 520 | 516 | 544 | | B | 448 | 436 | 444 | 436 | 436 |
|
查看原文
表 6不同显示设备和不同颜色中心的颜色匹配实验结果
Table6. Color-matching experimental results for different display devices and different color stimuli
| Item | No.1 | | No.2 | | No.3 | No.4 and No.5 |
|---|
| No.2 | | No.3 | No.4 | No.5 | No.3 | No.4 | No.5 | No.4 | No.5 |
|---|
| Gray | 7.40 | 6.32 | 10.18 | 3.37 | | 4.26 | 4.69 | 6.14 | | 6.59 | 5.43 | 8.76 | | Red | 6.14 | 4.82 | 7.41 | 3.31 | | 4.67 | 4.49 | 4.77 | | 5.55 | 4.46 | 5.74 | | Yellow | 9.77 | 9.05 | 10.10 | 4.69 | | 4.68 | 5.08 | 7.86 | | 6.55 | 7.27 | 8.97 | | Green | 6.96 | 6.51 | 9.08 | 3.33 | | 4.06 | 4.37 | 6.20 | | 5.53 | 5.60 | 8.04 | | Blue | 7.79 | 7.11 | 11.17 | 4.75 | | 4.37 | 4.92 | 6.71 | | 6.45 | 6.50 | 9.61 | | Mean | 7.61 | 6.76 | 9.59 | 3.89 | | 4.41 | 4.71 | 6.33 | | 6.13 | 5.85 | 8.22 |
|
查看原文
黄敏, 何瑞丽, 郭春丽, 习永惠, 刘瑜. 基于不同显示设备的观察者同色异谱差异研究[J]. 光学学报, 2019, 39(1): 0133001. Min Huang, Ruili He, Chunli Guo, Yonghui Xi, Yu Liu. Discrimination of Observer Metamerism Based on Different Display Devices[J]. Acta Optica Sinica, 2019, 39(1): 0133001.


 PDF全文
PDF全文