Advanced Photonics, 2019, 1 (6): 066001, Published Online: Nov. 12, 2019   

Deep-learning cell imaging through Anderson localizing optical fiber Download: 850次

Author Affiliations
1 University of Central Florida, CREOL, The College of Optics and Photonics, Orlando, Florida, United States
2 Chinese Academy of Sciences, Changchun Institute of Optics, Fine Mechanics and Physics, State Key Laboratory of Luminescence and Applications, Changchun, China
Figures & Tables

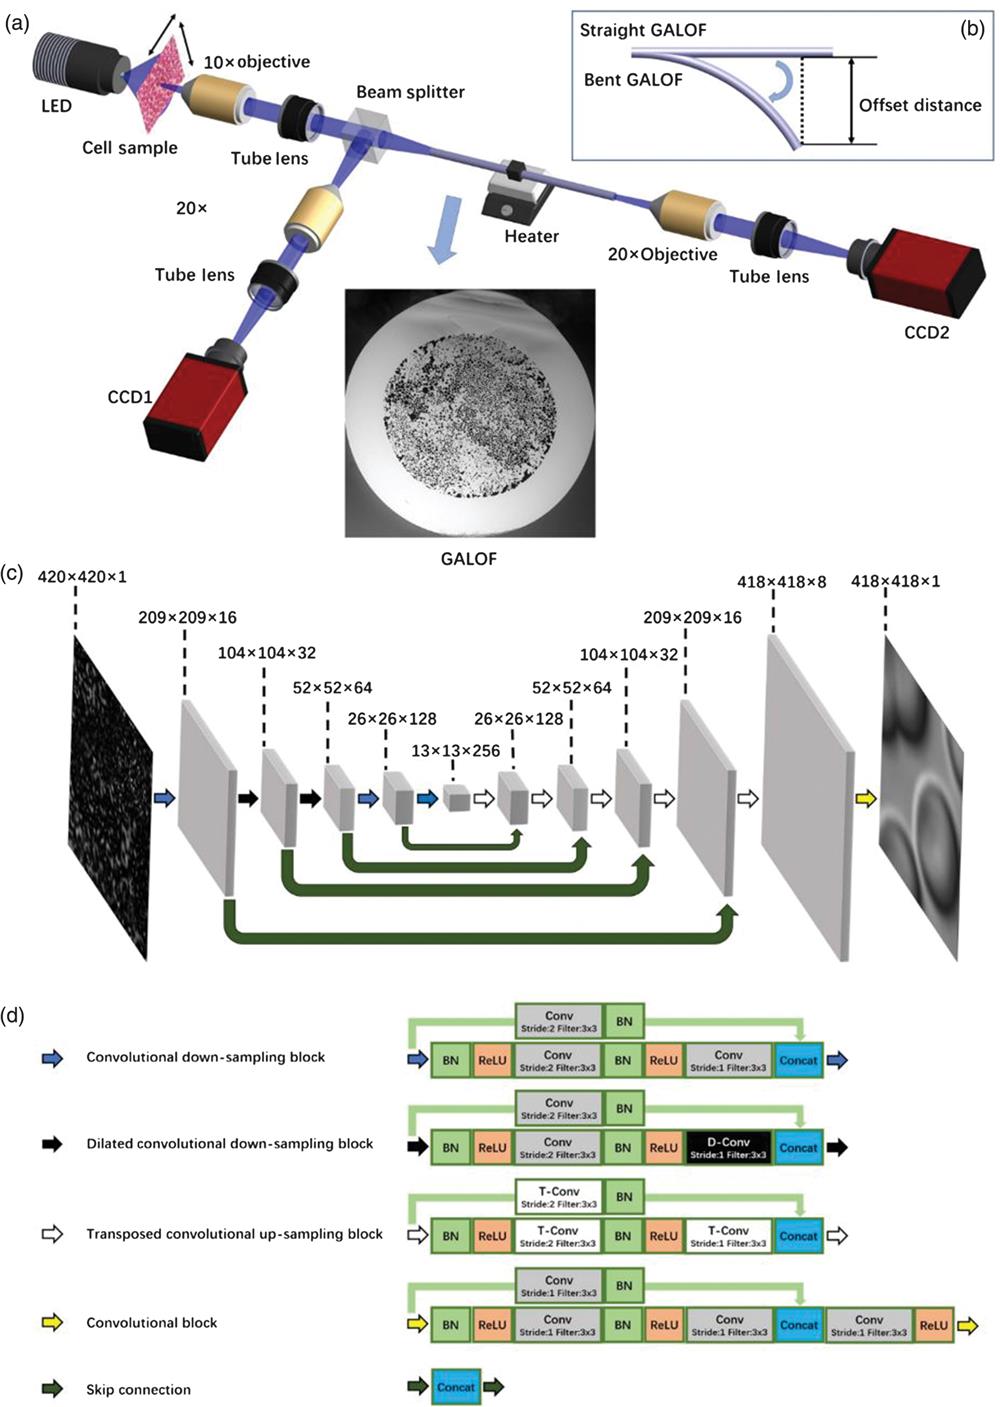
Fig. 1. Schematic of the cell imaging setup and the architecture of the DCNN.

下载图片 查看原文

Fig. 2. Cell imaging of different types of cells: (a)–(c) test data for human red blood cells and (d)–(f) test data for cancerous human stomach cells. All data are collected with straight GALOF, at room temperature with 0-mm imaging depth. The length of the scale bar in (a1) is 4  μm. (a1)–(f1) The reference images. (a2)–(f2) The corresponding raw images. (a3)–(f3) The images recovered from the raw images. [Video S1, avi, 10 MB (URL: https://doi.org/10.1117/1.AP.1.6.066001.1)].

下载图片 查看原文

Fig. 3. Multiple depth cell imaging: (a)–(f) Test data for human red blood cells. All data are collected with straight GALOF at room temperature. All three images in each column are from the same depth. The length of the scale bar in (a1) is 4  μm. (a1)–(f1) The reference images; (a2)–(f2) the corresponding raw images. The distance between the image of the object and the fiber input facet is defined as the depth. Initially, the image of the object is located at the GALOF’s input facet with 0-mm depth. Then the imaging depth is increased in steps of 1 mm by moving the fiber input end using a translation stage. As illustrated in (g), (a2)–(f2) are obtained by varying the imaging depth from 0 to 5 mm with steps of 1 mm. (a3)–(f3) The images recovered from the corresponding raw images. (h) The averaged test MAE for each depth with the standard deviation as the error bar. More sample results, including reference, raw, and recovered images, are shown in Fig. S2 in the Supplementary Material.

下载图片 查看原文

Fig. 4. Cell imaging at different temperatures. (a1)–(c1) Test raw images of human red blood cells collected at 20°C, 35°C, and 50°C, respectively. The scale bar length in (a1) is 4  μm. (a2)–(c2) Images recovered from (a1)–(c1); (a3)–(c3) the corresponding reference images. All data are collected with straight GALOF at 0-mm imaging depth. (d) The averaged test MAE for each temperature with the standard deviation as the error bar. More test sample results, including reference, raw, and recovered images, are provided in Fig. S3 in the Supplementary Material.

下载图片 查看原文

Fig. 5. Cell imaging under bending. (a)–(e) Data in each column correspond to examples with the bending offset distance listed above. The definition of offset distance is illustrated in Fig. 1(b). The bending angle range corresponding to offset distances between 0 and 2 cm is about 3 deg. For more details, see Sec. 2. (a1)–(e1) Raw images collected at different bending offset distances. The scale bar length in (a1) is 4  μm. (a2)–(e2) Images reconstructed from (a1)–(e1); (a3)–(e3) the corresponding reference images. (f) Averaged test MAE for five different bending states with the standard deviation as the error bar. More sample results of human red blood cells, including reference, raw, and recovered images, are provided in Fig. S4 in the Supplementary Material.

下载图片 查看原文

Fig. 6. Cell imaging transfer learning. (a)–(c) Sample cell images in the set of training data. The scale bar length in (a) is 4  μm. There are three different types of cells in the set of training data: (a) an image of human red blood cells, (b) an image of frog blood cells, and (c) an image of polymer microspheres. (d)–(f) Test process using data from images of bird blood cells. (d1)–(d4) Raw images of bird blood cells transported through straight GALOF taken at 0 mm imaging depth and at room temperature. (e1)–(e4) Images reconstructed from (d1)–(d4); (f1)–(f4) the corresponding reference images of bird blood cells. (g) Training and validation accuracy improvement curves using MAE as the metric over 80 epochs. (h) Averaged test MAE of the bird blood cell images with the standard deviation as the error bar.

下载图片 查看原文

Jian Zhao, Yangyang Sun, Hongbo Zhu, Zheyuan Zhu, Jose E. Antonio-Lopez, Rodrigo Amezcua Correa, Shuo Pang, Axel Schulzgen. Deep-learning cell imaging through Anderson localizing optical fiber[J]. Advanced Photonics, 2019, 1(6): 066001.
本文已被 2 篇论文引用
被引统计数据来源于中国光学期刊网
引用该论文: TXT   |   EndNote

相关论文

加载中...

关于本站 Cookie 的使用提示

中国光学期刊网使用基于 cookie 的技术来更好地为您提供各项服务,点击此处了解我们的隐私策略。 如您需继续使用本网站,请您授权我们使用本地 cookie 来保存部分信息。
全站搜索
您最值得信赖的光电行业旗舰网络服务平台!