Chinese Optics Letters, 2019, 17 (10): 100603, Published Online: Sep. 25, 2019
Analyzing OAM mode purity in optical fibers with CNN-based deep learning  Download: 903次
Figures & Tables
Fig. 1. (a) Schematic with a superimposed mode at the exit of the optical fiber and the corresponding far-field pattern that can be easily recorded by an imaging device (e.g., CCD) and analyzed by CNN. (b) Mode profiles including the electric intensity profiles and phase profiles of the
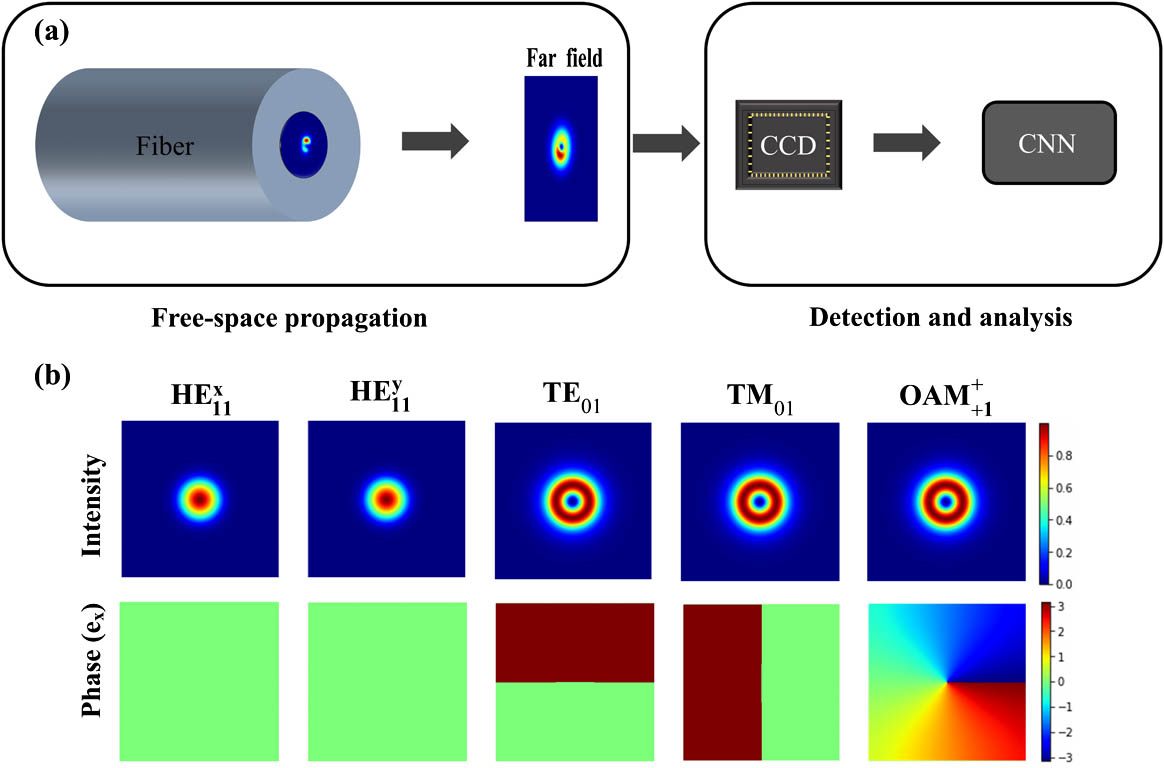
Fig. 2. Diagram of our proposed CNN architecture to predict the OAM mode purity. The CNN architecture consists of eight layers with three convolutional layers (

Fig. 3. (a) Training progress of our proposed CNN-based prediction model. (b) Histogram of AE distribution of 1000 testing samples. Inset: histogram with AE larger than 0.01.

Fig. 4. Predicted OAM mode purities versus the labeled ones for both the training set and the testing set.

Fig. 5. Prediction accuracy as a function of the size of the testing set with the tolerance of 0.02.

Fig. 6. (a) Predicted OAM mode purities versus the labels for both the training set and the testing set when phase differences exist between different modes in the optical fiber. (b) Histogram of AE distribution of 10,000 testing samples. Inset: histogram with AE larger than 0.02.


Tianying Lin, Ang Liu, Xiaopei Zhang, He Li, Liping Wang, Hailong Han, Ze Chen, Xiaoping Liu, Haibin Lü. Analyzing OAM mode purity in optical fibers with CNN-based deep learning[J]. Chinese Optics Letters, 2019, 17(10): 100603.


 PDF全文
PDF全文

