Photonics Research, 2020, 8 (7): 07001213, Published Online: Jun. 30, 2020
Multitask deep-learning-based design of chiral plasmonic metamaterials  Download: 621次
Figures & Tables
Fig. 1. Schematic of (a) a single YNP chiral meta-absorber array with definition of incident circularly polarized lights and a unit cell with dimensions. (b) Three single YNP metastructure configurations: Au YNP/Glass (YG), Au YNP/PMMA/Glass (YPG), and Au YNP/PMMA/Au/Glass (YPAG). (c) Absorption and CD spectra of the three metastructure configurations (YG, YPG, and YPAG), showing their plasmonic resonances λ p λ p = 620 nm R 0 = 100 nm t 1 = 40 nm t 2 = 50 nm t 3 = 100 nm t 4 = 200 nm
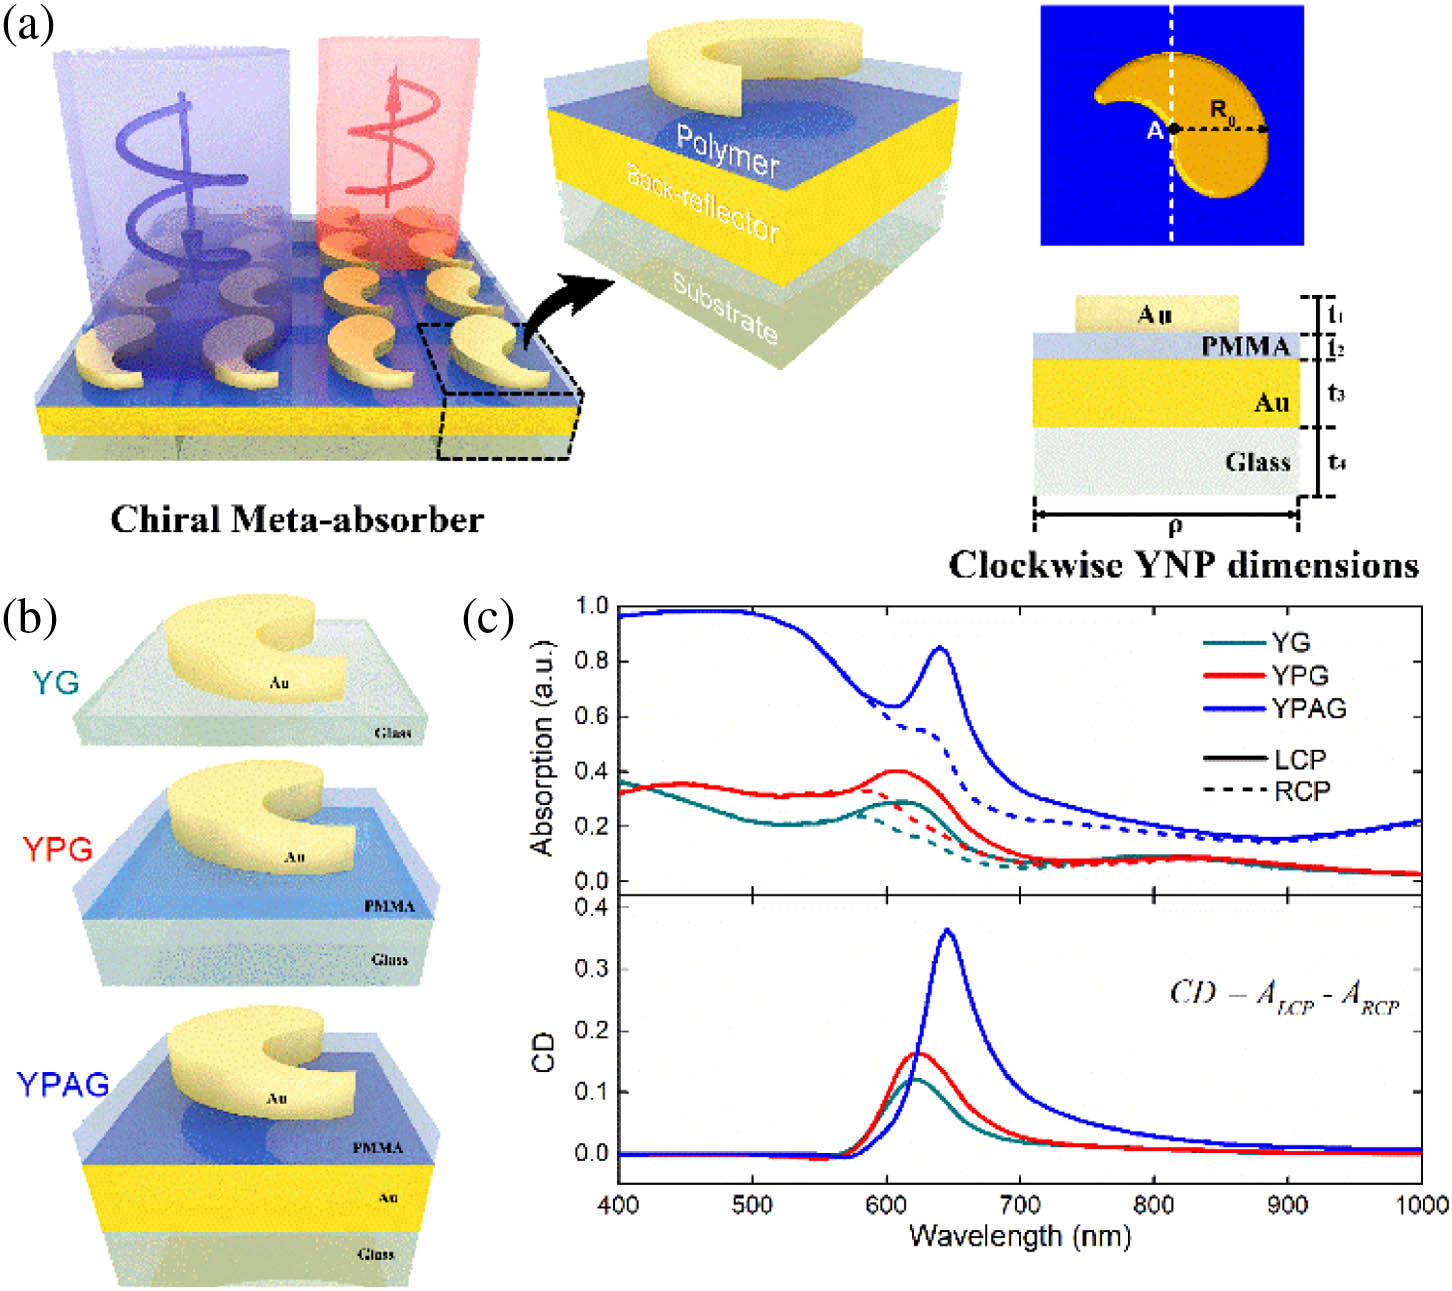
Fig. 2. Schematic of the bidirectional multitask deep-learning model for chiral metamaterial design consisting of forward design path (FDP) and inverse design path (IDP). Each path is composed by shared layers and task specific layers with joint optimization functionality. The model is set up in an end-to-end fashion where the geometric design parameters, CD, and LCP/RCP absorption spectra can be treated as input or output at specific ports. Here, the geometric design parameters are the YNPs thickness, PMMA thickness, YNPs radius, and YNPs (respectively represented as x i i = 1 , 2 , … , 6 x 4

Fig. 3. MDL model performance. (a) Numerical simulation and (b) MDL prediction CD results of the dimer structure at varying gap distance d R 0 = 100 nm t 1 = 40 nm t 2 = 50 nm t 3 = 100 nm t 1 ± 0.2 d . (e) Learning curve within 3000 epochs. (f) Discretized model performance at selected t 1 λ 0 = 755 nm t 1 R 0 = 100 nm d = 100 nm t 2 = 50 nm t 3 = 100 nm

Fig. 4. MDL-predicted CD progressions. (a) CD evolution by varying YNP radius at t 3 t 1 λ 0 = 780 nm R 0 λ 0 = 700 nm t 2 λ 0 = 650 nm ± 0.2

Fig. 5. Inverse design with the MDL model. (a), (b) Simulated (green solid lines) and predicted (red dots) CD spectra. (c), (d) Corresponding simulated (green bars) and retrieved (red bars) geometric parameters. Red dots in (a), (b) are predicted from the MDL model with geometric parameters retrieved [red bar in (c), (d)] for the target simulated CD spectra in (a), (b). [See Figs. 9(a) and 9(b) in Appendix C for absorption spectra comparison.]

Fig. 6. Enantiomer detection. (a) The CD spectra of (red) left-handed medium (LH m RH m λ m = 380 nm RH cma λ p λ p = 665 nm λ m λ p λ m p L D λ m p = 720 nm

Fig. 7. Electric field and surface charge density distributions of the three single YNP metastructure configurations (YG, YPG, YPAG) at their plasmonic resonances, showing huge enhancement for the metamaterial absorber case. The cut plane is through point A, the unit cell center [Fig. 1(a) ].

Fig. 8. Optical and chiroptical properties of the chiral metamaterial absorber with 10 nm tip rounding radius. (a) Absorption and (b) reflection spectra of single yin-yang metamaterial absorber at varying polymer thicknesses. Corresponding (c) CD and (d) g CD from (a) exhibiting a strong peak in the visible regime (around 635 nm wavelength). CD response from three gapped configurations of the chiral metamaterial absorber: (e) dimer, varying gap length d r

Fig. 9. Inverse design plots. Simulated and MDL-retrieved absorption spectra comparison for the systems providing the data in (a) Fig. 5(a) and (b) Fig. 5(b) . (c) Comparison between the CD values obtained with different variations of the ML techniques: separately training LCP and RCP spectra (black dashes), training only CD without auxiliary tasks (red dashes), training by our MDL model (blue dashes), and the ground-truth (pink solid line). The inset is a zoomed-in image at the resonances.

Fig. 10. MDL-predicted CD progressions. CD evolution when varying PMMA thickness at t 1 R 0 = 100 nm 3 , where we observe only CD maxima for t 1 = 30 nm t 1 = 60 nm t 1 = 90 nm

Eric Ashalley, Kingsley Acheampong, Lucas V. Besteiro, Peng Yu, Arup Neogi, Alexander O. Govorov, Zhiming M. Wang. Multitask deep-learning-based design of chiral plasmonic metamaterials[J]. Photonics Research, 2020, 8(7): 07001213.


 PDF全文
PDF全文

