Chinese Optics Letters, 2019, 17 (5): 051403, Published Online: May. 13, 2019   

1.57 times diffraction-limit high-energy laser based on a Nd:YAG slab amplifier and an adaptive optics system Download: 1555次Cover Paper

Author Affiliations
1 Center for Photonics and Electronics, Department of Precision Instruments, Tsinghua University, Beijing 100084, China
2 Technical Institute of Physics and Chemistry, Chinese Academy of Sciences, Beijing 100190, China
Figures & Tables

Fig. 1. Schematic of the Nd:YAG slab amplifier with an AO configuration. HR, high reflection mirror; PBS, polarization beam splitter; GM, gain module; QWP, quarter-wave plate; TS, telescope.

下载图片 查看原文

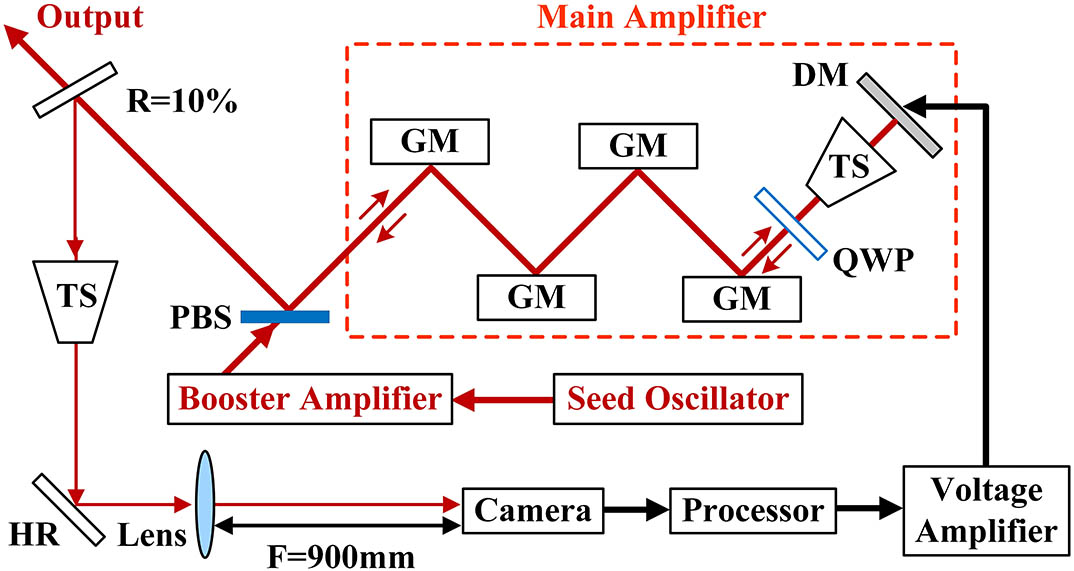
Fig. 2. (a) LD array. (b) Gain module without shaping optics. (c) Simulation pump intensity distribution in a Nd:YAG slab without shaping optics. The red rectangle represents the laser beam in a Nd:YAG slab.

下载图片 查看原文

Fig. 3. Experimental results with the 3×1 pump-beam array. Near-field intensity distribution (a) before correction, DN=4.09mm and (b) after correction, DN=4.55mm. Far-field intensity distribution (c) before correction, DF=5.10mm, HBQ=10.89 and (d) after correction, DF=2.33mm, HBQ=5.54. The circles in the far-field pattern represent the measured beam diameters.

下载图片 查看原文

Fig. 4. Actuators distribution of the DM and the 3×1 beam array.

下载图片 查看原文

Fig. 5. Correction result of the defocus distributed in a 3×1 array. (a) Wavefront before correction. (b) Far-field intensity distribution before correction, HBQ=10.89. (c) Wavefront after correction. (d) Far-field intensity distribution after correction, HBQ=6.44. The far-field intensity distributions were initialized by the peak value of the far-field intensity of an ideal square-flat-topped beam.

下载图片 查看原文

Fig. 6. Correction result of the defocus distributed in a 1×1 array. (a) Wavefront before correction. (b) Far-field beam intensity distribution before correction, HBQ=4.32. (c) Wavefront after correction. (d) Far-field beam intensity distribution after correction, HBQ=1.01.

下载图片 查看原文

Fig. 7. HBQ after correction with different beam arrays.

下载图片 查看原文

Fig. 8. (a) Gain module with a pump-light homogenizer. (b) Simulation pump intensity distribution in a Nd:YAG slab with a pump-light homogenizer.

下载图片 查看原文

Fig. 9. Experimental results with the pump-beam array. Near-field intensity distribution (a) before correction, DN=3.01mm, and (b) after correction, DN=3.31mm. Far-field intensity distribution (c) before correction, DF=3.49mm, HBQ=5.49, and (d) after correction, DF=0.91mm, HBQ=1.57.

下载图片 查看原文

Table1. PV Value, RMS Value, and HBQ of the Defocus Distributed in Different Arrays After Correction

Array Dimension1×12×12×23×13×3
PV/μm0.703.726.306.418.74
RMS/μm0.050.340.521.011.19
HBQ1.011.702.876.447.22

查看原文

Licheng Sun, Tinghao Liu, Xing Fu, Yading Guo, Xiaojun Wang, Chongfeng Shao, Yamin Zheng, Chuang Sun, Shibing Lin, Lei Huang. 1.57 times diffraction-limit high-energy laser based on a Nd:YAG slab amplifier and an adaptive optics system[J]. Chinese Optics Letters, 2019, 17(5): 051403.

本文已被 2 篇论文引用
被引统计数据来源于中国光学期刊网
引用该论文: TXT   |   EndNote

相关论文

加载中...

关于本站 Cookie 的使用提示

中国光学期刊网使用基于 cookie 的技术来更好地为您提供各项服务,点击此处了解我们的隐私策略。 如您需继续使用本网站,请您授权我们使用本地 cookie 来保存部分信息。
全站搜索
您最值得信赖的光电行业旗舰网络服务平台!