Photonics Research, 2020, 8 (11): 11001725, Published Online: Oct. 28, 2020
Revealing the intrinsic nonlinear optical response of a single MoS2 nanosheet in a suspension based on spatial self-phase modulation Download: 662次
Figures & Tables
Fig. 1. (A) TEM image of a MoS 2 nanosheet (scale bar: 500 nm). (B) STEM image and EDX mapping images of MoS 2 nanosheets (scale bar: 100 nm). (C) AFM image of present MoS 2 nanosheets (scale bar: 5 μm). (D) The height profile corresponding to the solid line in (C). (E) and (F) XRD pattern and Raman spectrum of the MoS 2 nanosheet.
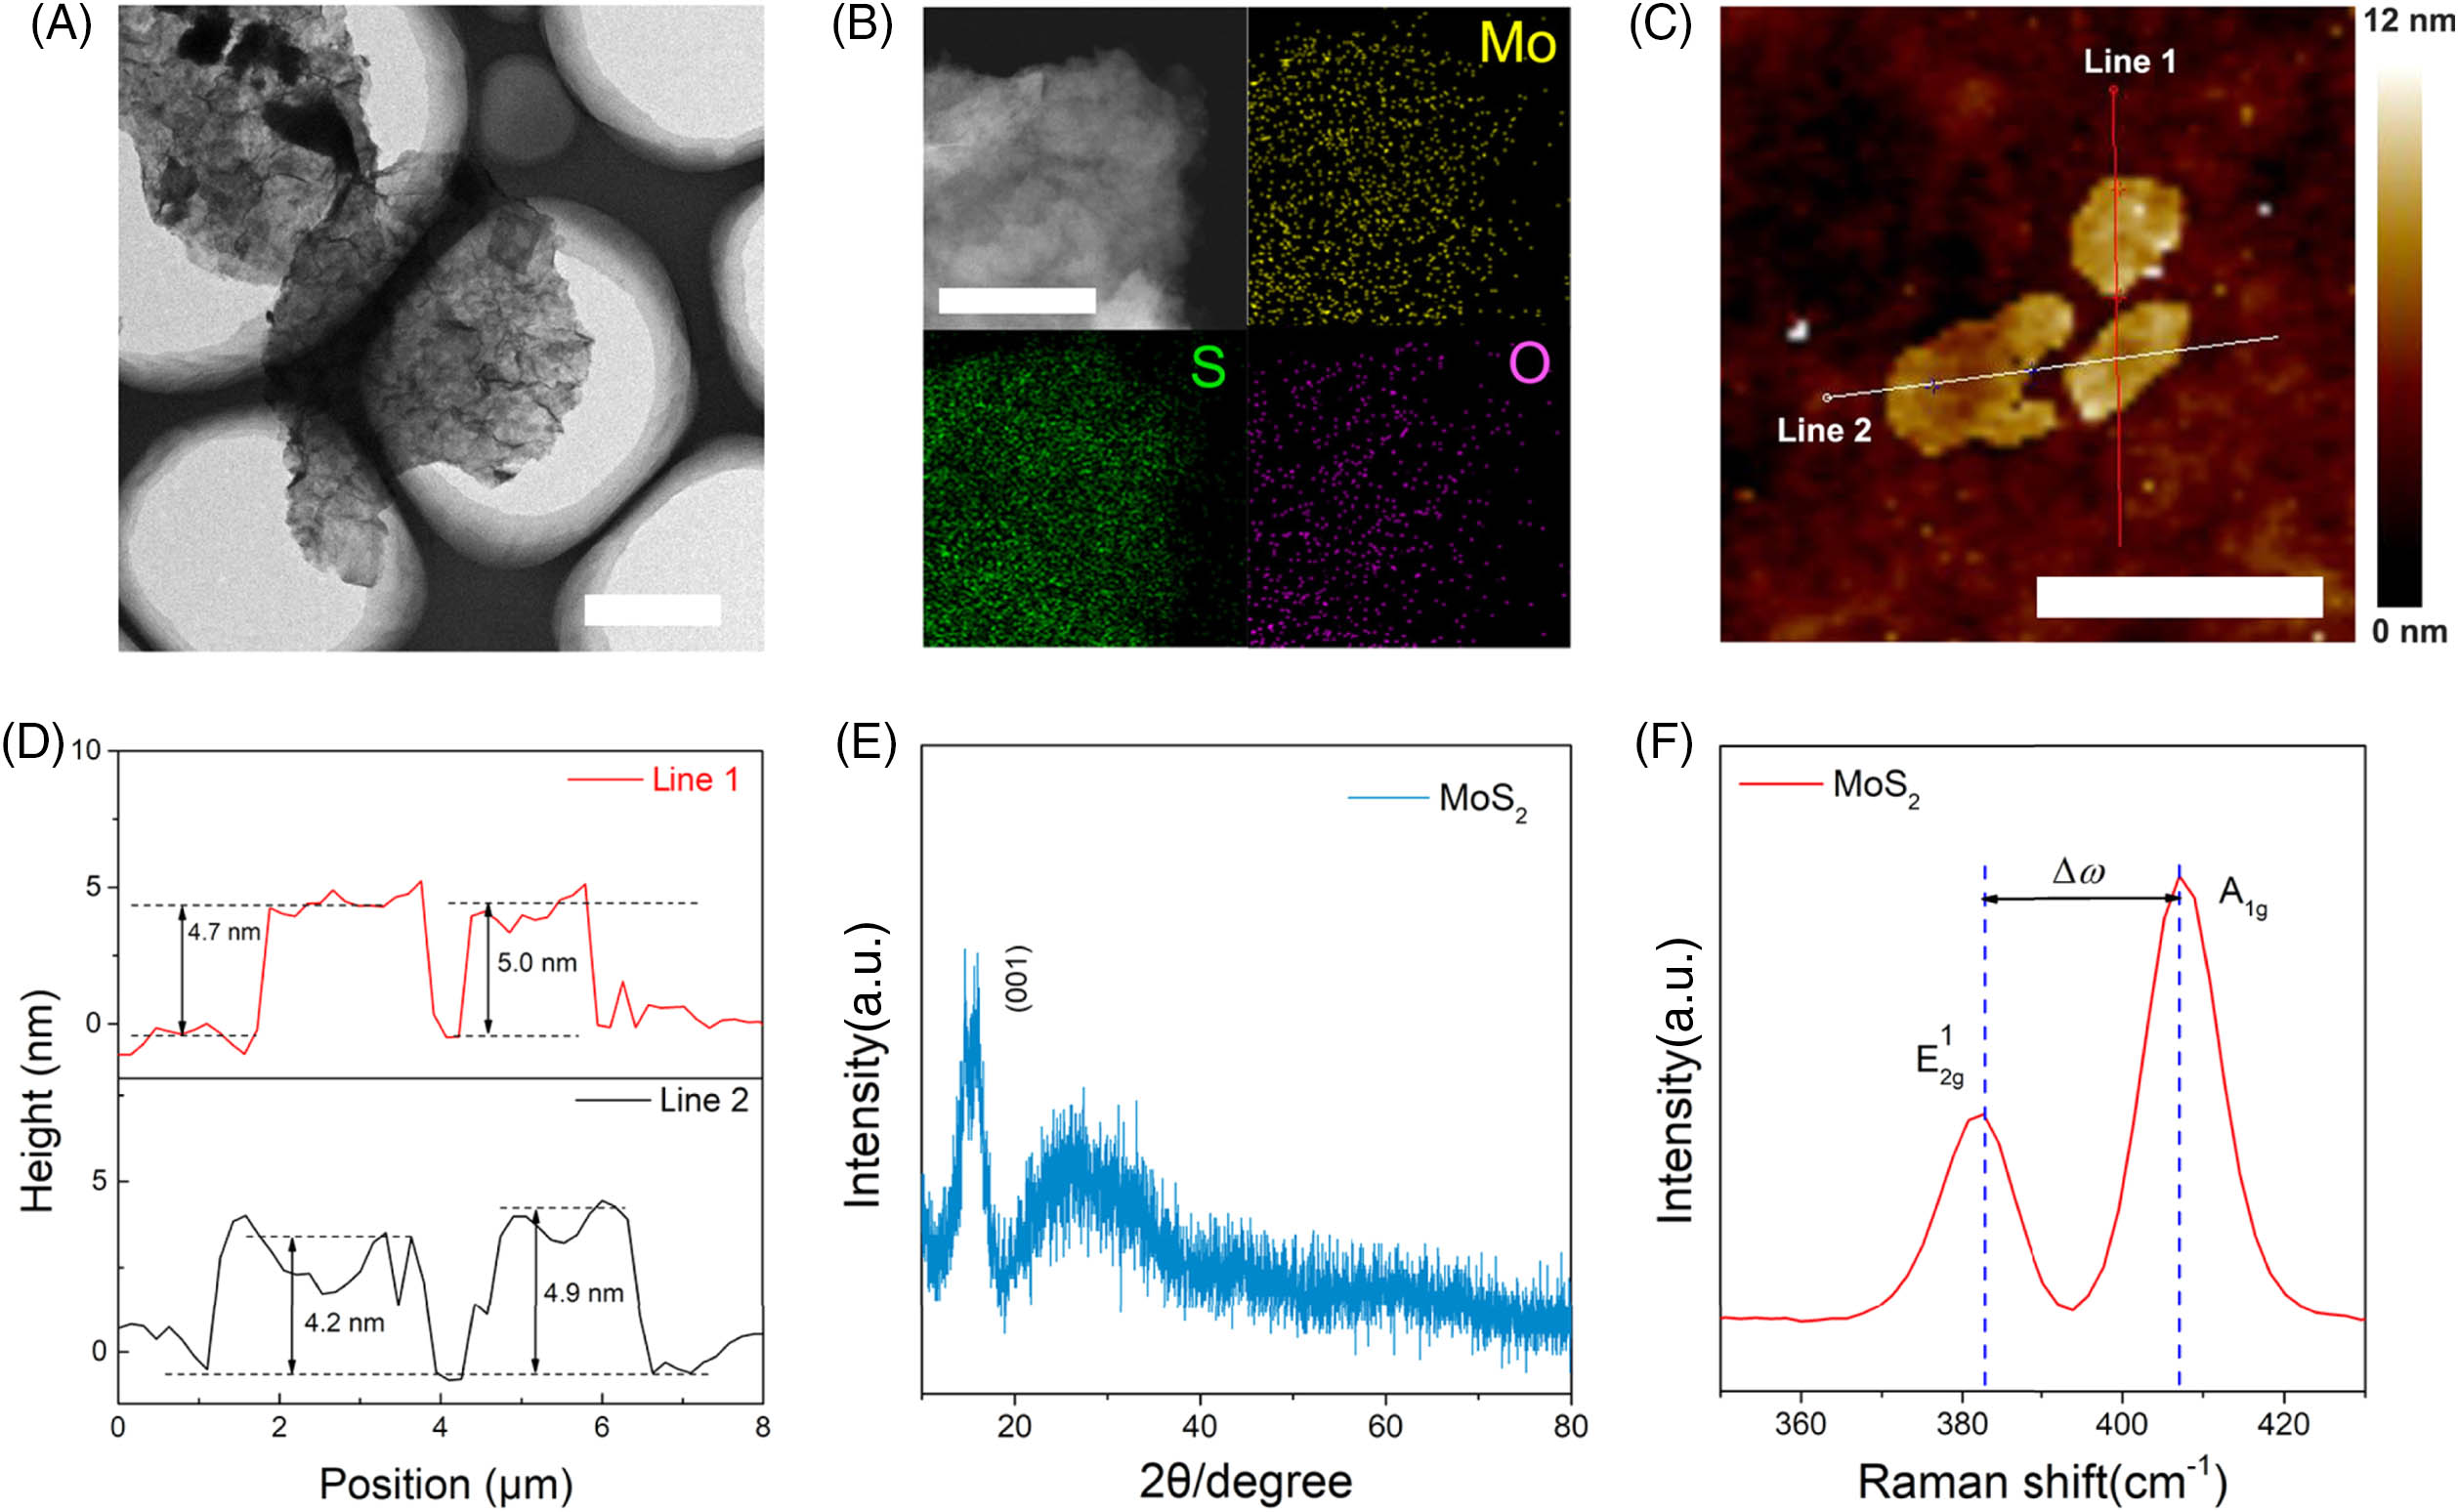
Fig. 2. (A) Schematic illustration of experimental facility for SSPM experiment measurement. (B) and (C), Photographs of 0.25%, 0.5%, and 0.75% (mass fraction) agarose gel samples (B) without MoS 2 and (C) with MoS 2 . (B1)–(B3) and (C1)–(C3), SSPM patterns of samples (B1), (B2), (B3), and (C1), (C2), (C3) at 680 nm, under the same conditions. Samples (B1) and (C1) are fluids, (B2) and (C2) are quasi-solids, while (B3) and (C3) are solids. The clear enhancement observed in sample (C1) in a liquid suggests that wind-chime flakes contribute to SSPM.
Fig. 3. Schematic of the general wind-chime model. (A) Schematic distribution diagram of MoS 2 nanosheets with laser irradiation. Some random flakes convert into wind-chime flakes (red) because of the laser field, while the other portion of random flakes (gray) is still distributed randomly. The number of wind-chime flakes decreases because of the intensity attenuation in the transmission direction. The interaction length is L (∼ 10 mm ), and the beam radius is ω R (∼ 300 μm ). A total is the amount of nanosheets in the laser field. (B)–(E) represent the variation of wind-chime flakes with increasing laser intensity or concentration. The general wind-chime model can be applied to all of these conditions.
Fig. 4. Dependence of ring numbers on laser intensity, concentration, and interaction length. (A) Transmittance of the MoS 2 dispersions for different concentrations at 680 nm. The inset is a photograph of the samples. The extinction coefficient α is 437.3 mL · mg − 1 · m − 1 according to the Lambert–Beer law. (B) Ring numbers vary with incident light intensity and concentration (the interaction length L is 10 mm). The experimental values and calculation results, using Eq. (4 ), are also shown. (C) Relationship between the number of rings and the interaction length for different laser intensities (concentration = 0.1875 mg / mL ). All dots represent measured values, while the curved surface and the lines are the calculated results using Eq. (4 ).
Fig. 5. Laser intensity attenuation curve along the optical path under different conditions: (A) I out < I th ; (B) I th < I out < I sa ; (C) I out > I sa . Inset: the dashed line indicates two critical incident light intensities (I sa and I th ), where 100% or 0% active flakes are involved with SSPM in dispersions. (D) Contour plot of the experimental ring numbers at different concentrations and incident light intensities. The map was divided into three parts by two dashed lines, which were determined based on the threshold intensity I th and the saturation intensity I sa . (E) Trend of the laser intensity attenuation curve along the optical path, which corresponds to the change of incident intensity I 0 or concentration c , for the three typical cases located in different zones.
Table1. Calculated Values for of a Single Nanosheet Involved in SSPM
|
Si Xiao, Ying Ma, Yilin He, Yiduo Wang, Hao Xin, Qi Fan, Jingdi Zhang, Xiaohong Li, Yu Zhang, Jun He, Yingwei Wang. Revealing the intrinsic nonlinear optical response of a single MoS2 nanosheet in a suspension based on spatial self-phase modulation[J]. Photonics Research, 2020, 8(11): 11001725.