Advanced Photonics, 2020, 2 (6): 065001, Published Online: Oct. 22, 2020
Plasma-grating-induced breakdown spectroscopy  Download: 757次
Figures & Tables
Fig. 1. Experimental schematic. Top view of the noncollinear interaction area where two filaments interfere and create a plasma grating, with a focus lens collecting the plasma emission into the spectrometer from the side direction after plasma grating ablating the sample pellet.
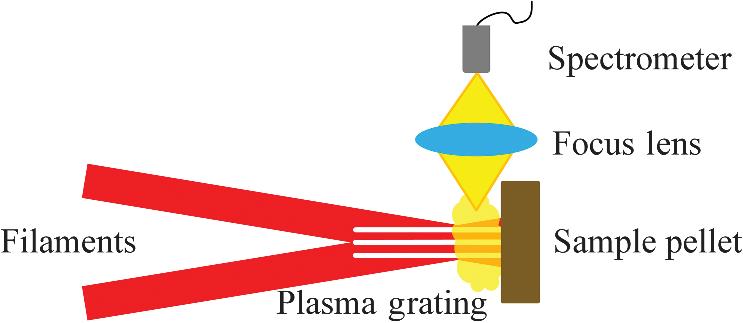
Fig. 2. (a) Intensity of the Si 288.2 nm line as a function of the laser pulse energy detected with the FIBS and GIBS systems. (b) Intensity of the Si 288.2 nm line obtained by interaction of two beams with different polarizations.

Fig. 3. Time evolution for intensities of four spectral lines (Al 394.5 nm, Ca 393.4 nm, Mg 517.3 nm, and Si 288.2 nm) detected with (a) an FIBS and (b) a GIBS system.


Table1. Element concentrations of soil samples in the experiment.
|
Mengyun Hu, Junsong Peng, Sheng Niu, Heping Zeng. Plasma-grating-induced breakdown spectroscopy[J]. Advanced Photonics, 2020, 2(6): 065001.


 PDF全文
PDF全文

