Chinese Optics Letters, 2018, 16 (4): 040604, Published Online: Jul. 12, 2018
SER estimation method for 56 GBaud PAM-4 transmission system
Figures & Tables
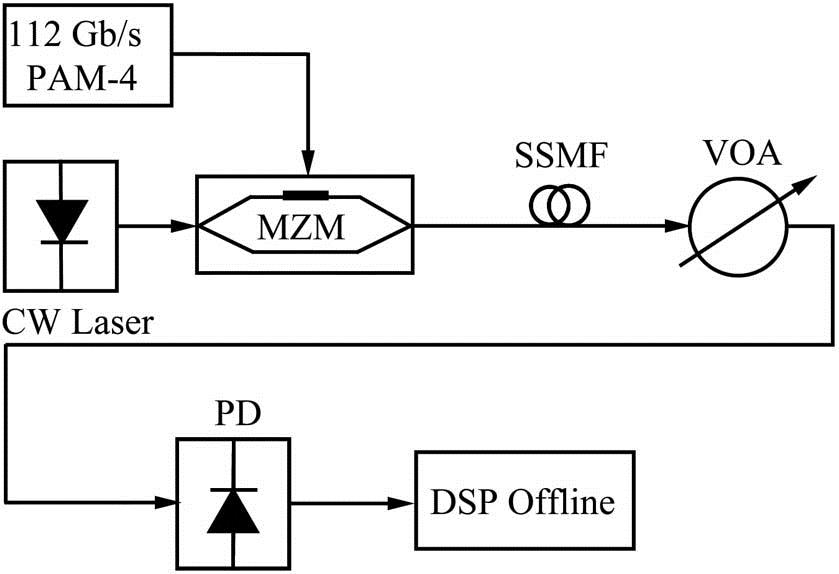
Fig. 2. Contour plots at (a) − 4.41 dBm − 5.06 dBm − 5.71 dBm − 6.36 dBm − 7.01 dBm − 7.66 dBm Z = 0

Fig. 3. Contour lines at Z = 0

Fig. 4. (a) SER versus ROPs at different bandwidths. (b) Contour plot at − 5.71 dBm P P − 4.41 − 5.06 − 5.71 − 6.36 − 7.01 dBm SER C SER Q SER GGD P

Fig. 5. (a) Eye-diagram and (b) probability distribution function of the received signal of PAM-4 at − 7.66 dBm


Fig. 7. Contour lines at Z = 0 − 4 − 5 − 6 − 7 P P at BtB and 10 km.


Table1. Simulation Parameters
|
Aadil Raza, Kangping Zhong, Salman Ghafoor, Saeed Iqbal, Muhammad Adeel, Shahid Habib, Muhammad Fasih Uddin Butt, Chao Lu. SER estimation method for 56 GBaud PAM-4 transmission system[J]. Chinese Optics Letters, 2018, 16(4): 040604.


 PDF全文
PDF全文

