Chinese Optics Letters, 2017, 15 (8): 081103, Published Online: Jul. 20, 2018
Enhanced quantitative X-ray phase-contrast images using Foucault differential filters  Download: 778次
Figures & Tables
Fig. 1. (Color online) Schematic diagram of the FDF method. S, X-ray tube source; A, lead aperture; SC, scintillation crystal; IO, visible light imaging optics; SP, specimen;
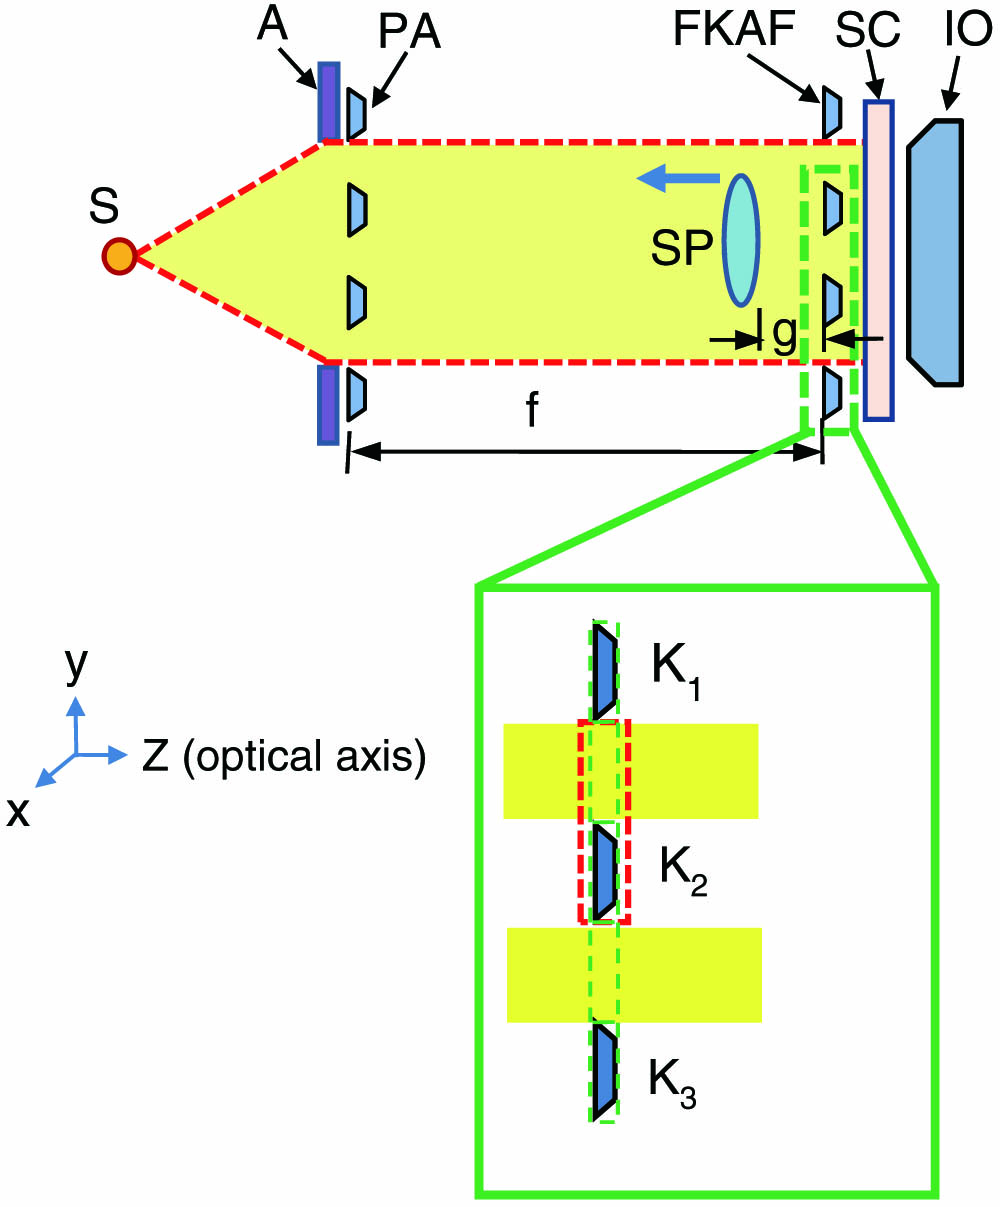
Fig. 2. Schematic of an example for the scan process to acquire FDF data in the

Fig. 3. Illustration of the concept of imaging the different surfaces using the FKA with optical axis translation of the specimen,

Fig. 4. Sequential QXPC images, where 1 ) was

Fig. 5. (Color online) (a) Surface rendering image is depicted, using the stacked images of the QXPC. (b) ROI of a region of the upper Pc. Cross-sectional cut lines (red dots) rotated to

Jaeho Choi, Young-Sung Park. Enhanced quantitative X-ray phase-contrast images using Foucault differential filters[J]. Chinese Optics Letters, 2017, 15(8): 081103.


 PDF全文
PDF全文

