Progress of the injection laser system of SG-II  Download: 657次
National Laboratory on High Power Laser and Physics, Shanghai Institute of Optics and Fine Mechanics, Chinese Academy of Sciences, Shanghai 201800, China
Figures & Tables
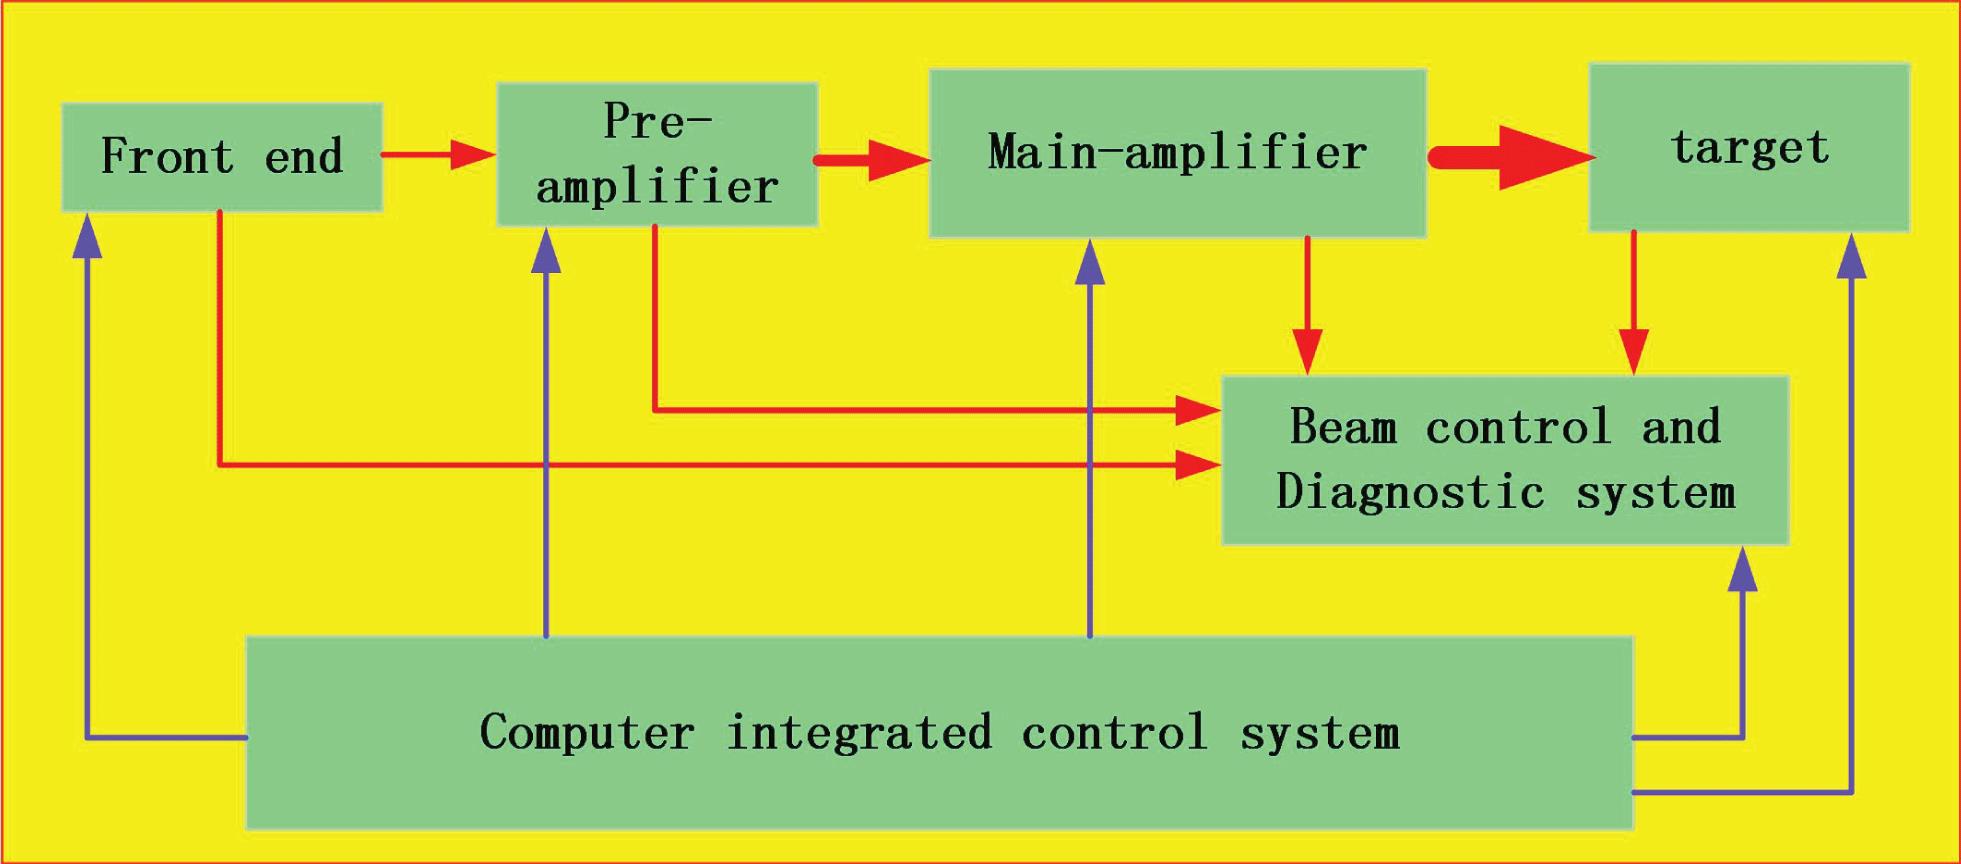
Fig. 1. High power laser diagram.
下载图片 查看原文
Fig. 2. The early integrated waveguide front-end system and pre-amplifier of SG-II (AMP: amplifier).
下载图片 查看原文
Fig. 3. The function of the injection laser system of SG-II.
下载图片 查看原文
Fig. 4. (a) The spectrum of a single frequency output; (b) the broadened spectrum with 3 GHz phase modulation; (c) the broadened spectrum with 22 GHz modulation; (d) the broadened spectrum with  modulation.
下载图片 查看原文
Fig. 5. (a) The relationship between the effective length and the actual length of the crystal under different velocity matching conditions (the design frequency is 10.5 GHz, the crystal is lithium niobate). (b) The structure of the resonant cavity modulator based on the cut-off waveguide (A: the injection waveguide; B, D: cutoff waveguide; C: electro-optic crystal).
下载图片 查看原文
Fig. 6. (a) The bulk modulator prototype. (b)  curve of 10.302 GHz bulk modulator.
下载图片 查看原文
Fig. 7. (a) The illustration and (b) physical map of the fail-safe system.
下载图片 查看原文
Fig. 8. (a) High-resolution single-shot spectrometer prototype; (b) the calibration results with the wavelength meter.
下载图片 查看原文
Fig. 9. The laser spectrum (bandwidth is 0.52 nm) which was measured using a home-made single-shot spectrometer.
下载图片 查看原文
Fig. 10. The early synchronization scheme of SG-II between the nanosecond shaped laser and the short pulse picosecond laser.
下载图片 查看原文
Fig. 11. Improved optically driven synchronization schematic.
下载图片 查看原文
Fig. 12. Synchronization stability testing results for (a) 4 minutes and (b) 2 hours between the nanosecond laser and the picosecond pulse laser.
下载图片 查看原文
Fig. 13. Homologous clock-lock, phase-locked frequency synchronization scheme.
下载图片 查看原文
Fig. 14. The temporal pulse shaping schematic.
下载图片 查看原文
Fig. 15. The high contrast temporal waveform (600 : 1). (a) Low amplitude pedestal; (b) high amplitude step.
下载图片 查看原文
Fig. 16. (a) Pre-placed injection waveform and (b) AWG closed-loop deviation.
下载图片 查看原文
Fig. 17. (a) The main amplifier output waveform; (b) the actual output and the expected output deviation.
下载图片 查看原文
Fig. 18. (a) The output laser waveform of Nd-doped regenerative amplifier and (b) the output laser waveform of one beam of SG-II at 5000 J,  (0.3 nm).
下载图片 查看原文
Fig. 19. The output spectrum with the 3 GHz and 22 GHz phase modulation.
下载图片 查看原文
Fig. 20. (a) The output waveform of the polarization-maintaining front-end system; (b) the output waveform of the single polarization front-end system.
下载图片 查看原文
Fig. 21. Phase modulation-to-amplitude modulation real-time monitoring software interface.
下载图片 查看原文
Fig. 22. FM-to-AM changes of single polarization front-end system (a) for 5 minutes and (b) for 3 hours.
下载图片 查看原文
Fig. 23. (a) Serrated aperture and (b) binary mask aperture.
下载图片 查看原文
Fig. 24. High damage threshold static near-field control element.
下载图片 查看原文
Fig. 25. The experimental results of the uniform intensity distribution (a) after shaped by anti-Gauss beam mask and the parabola distribution after shaped by pre-compensating binary mask of which the peak/center transmission ratio is 5 : 1. (b) The elliptical near-field distribution using binary mask.
下载图片 查看原文
Fig. 26. (a) The distribution of the binary mask. (b) The distribution of the four-pass amplifier without pre-compensation mask. (c) The output near-field distribution of the four-pass amplifier with pre-compensation mask.
下载图片 查看原文
Fig. 27. (a) The near-field distribution of SG-II-upgrade when operated at 8000 J without the second near-field binary shaping mask. (b) The design graphics of the 2nd near-field binary shaping mask. (c) The near-field distribution of SG-II when operated at 17,600 J with the second near-field binary mask.
下载图片 查看原文
Fig. 28. (a) Working principle and (b) the inner structure of the integrated optically addressed spatial modulator.
下载图片 查看原文
Fig. 29. (a) Optical addressing liquid crystal spatial light modulator physical map. (b) Near-field spatial intensity distribution control demonstration.
下载图片 查看原文
Fig. 30. Near-field intensity distribution control strategy (OALAV: optically addressed liquid addressed valve).
下载图片 查看原文
Fig. 31. The scheme of the regenerative amplifier.
下载图片 查看原文
Fig. 32. (a) The regenerative amplifier; (b) the output near-field spot; (c) the energy stability of the regenerative amplifier for one day; (d) the square-pulse distortion of the regenerative amplifier.
下载图片 查看原文
Fig. 33. Off-axis four-pass amplifier optical path diagram.
下载图片 查看原文
Fig. 34. Four-pass amplifier near-field beam spatial distribution. (b) is the one-dimensional distribution of (a).
下载图片 查看原文
Fig. 35. Four-pass pre-amplifier output focal spot distribution. (a) Two-dimensional distribution; (b) surrounding energy distribution.
下载图片 查看原文
Fig. 36. Coaxial four-pass amplifier structure.
下载图片 查看原文
Fig. 37. Near-field intensity distribution (a) without pre-compensation and (b) with pre-compensation.
下载图片 查看原文
Fig. 38. (a) Far-field intensity distribution and (b) surrounding energy distribution.
下载图片 查看原文
Fig. 39. The output energy stability of repetition pre-amplifier.
下载图片 查看原文
Fig. 40. Picosecond joule multi-functional experimental platform.
下载图片 查看原文
Fig. 41. (a) Output energy changes and (b) stability histograms.
下载图片 查看原文
Fig. 42. (a) Injection and output spectra. (b) Pulse width after compression.
下载图片 查看原文
Fig. 43. Parameter to amplify the signal-to-noise ratio measurement after compression.
下载图片 查看原文
Fig. 44. (a) The near-field light spot. (b) The near-field wavefront. (c) Far-field ambient energy.
下载图片 查看原文
Fig. 45. The OPCPA pump source includes: Nd:YAG regenerative amplifier, beam expander, soft-edge iris, spatial filter, three-stage Nd:YAG rod amplifier and frequency multiplier.
下载图片 查看原文
Fig. 46. (a) The output time waveform of the front end and (b) final output of the OPCPA pump source.
下载图片 查看原文
Fig. 47. The energy stability of the OPCPA pump source.
下载图片 查看原文
Fig. 48. The near-field distribution of the OPCPA pump source.
下载图片 查看原文
Wei Fan, Youen Jiang, Jiangfeng Wang, Xiaochao Wang, Dajie Huang, Xinghua Lu, Hui Wei, Guoyang Li, Xue Pan, Zhi Qiao, Chao Wang, He Cheng, Peng Zhang, Wenfa Huang, Zhuli Xiao, Shengjia Zhang, Xuechun Li, Jianqiang Zhu, Zunqi Lin. Progress of the injection laser system of SG-II[J]. High Power Laser Science and Engineering, 2018, 6(2): 02000e34.


 : 1
: 1 (PV, 120 ps)


 ; transmission rate
 tuning ability
 tuning ability
 doped amplifier


 (double stage)
 (double stage)
 V)
V)


 PDF全文
PDF全文

