Chinese Optics Letters, 2015, 13 (3): 031001, Published Online: Sep. 25, 2018
Radiography of a Kα X-ray source generated through ultrahigh picosecond laser–nanostructure target interaction  Download: 1005次
Figures & Tables
Fig. 1. (a) Schematic overview of the experiment setup. L–N means the laser is interacting with the nanowire structure directly. L–S means the laser is interacting with the substrate; (b) scanning electron microscopy image of the nanowire array target.
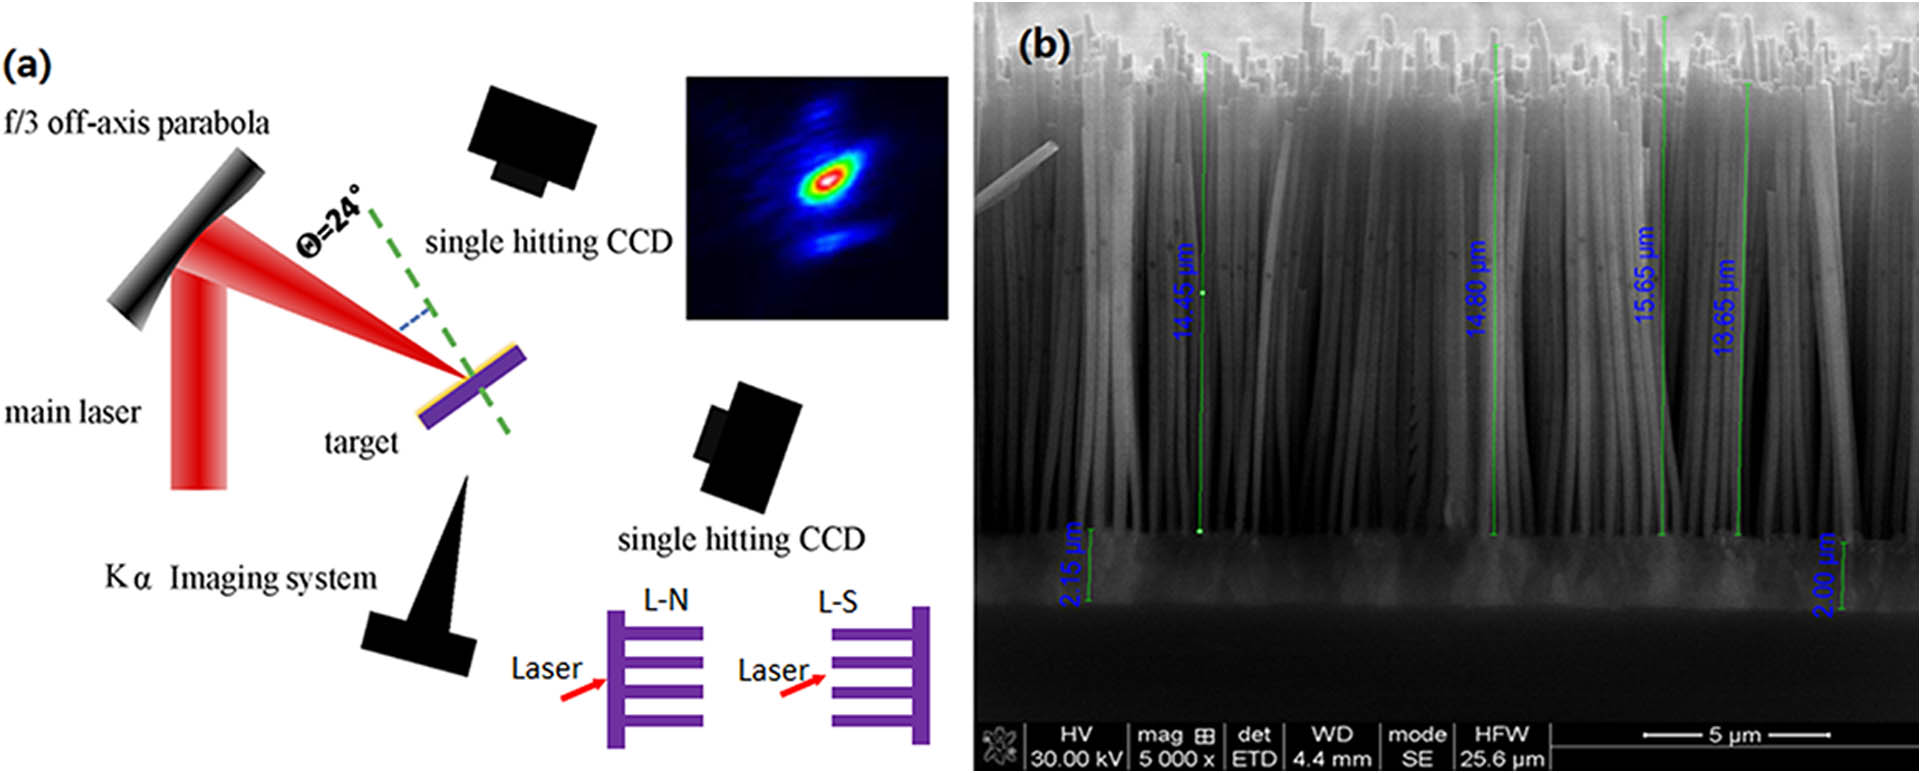
Fig. 2. (a) Spectrum of K-shell lines obtained for 94.8 J laser incidence on the target with 20 μm nanowires; (b) dependence of the total count of K α

Fig. 3. (a) Original K α 1 × 10 19 W / cm 2


Table1. Laser Energy versus FWHM of the PSF and CE
|
剑 王, 宗清 赵, 卫华 何, 斌 朱, 克攻 董, 玉迟 吴, 天奎 张, 牛 高, 凯南 周, 娜 谢, 维民 周, 渝秋 谷. Radiography of a Kα X-ray source generated through ultrahigh picosecond laser–nanostructure target interaction[J]. Chinese Optics Letters, 2015, 13(3): 031001.


 PDF全文
PDF全文

