激光与光电子学进展, 2020, 57 (17): 170001, 网络出版: 2020-09-01
角膜含水量光学测量方法研究综述  下载: 1891次封面文章
Review of Optical Measurement Methods for Corneal Water Content
图 & 表
图 1. Haag-Streit角膜厚度计[53]。(a)Haag-Streit制造的用于测量前房深度和角膜厚度的装置;(b)对准图像以测量角膜厚度
Fig. 1. Haag-Streit corneal pachymeter[53]. (a) Device for measuring anterior chamber depth and corneal thickness manufactured by Haag-Streit; (b) alignment of split images for measuring corneal thickness
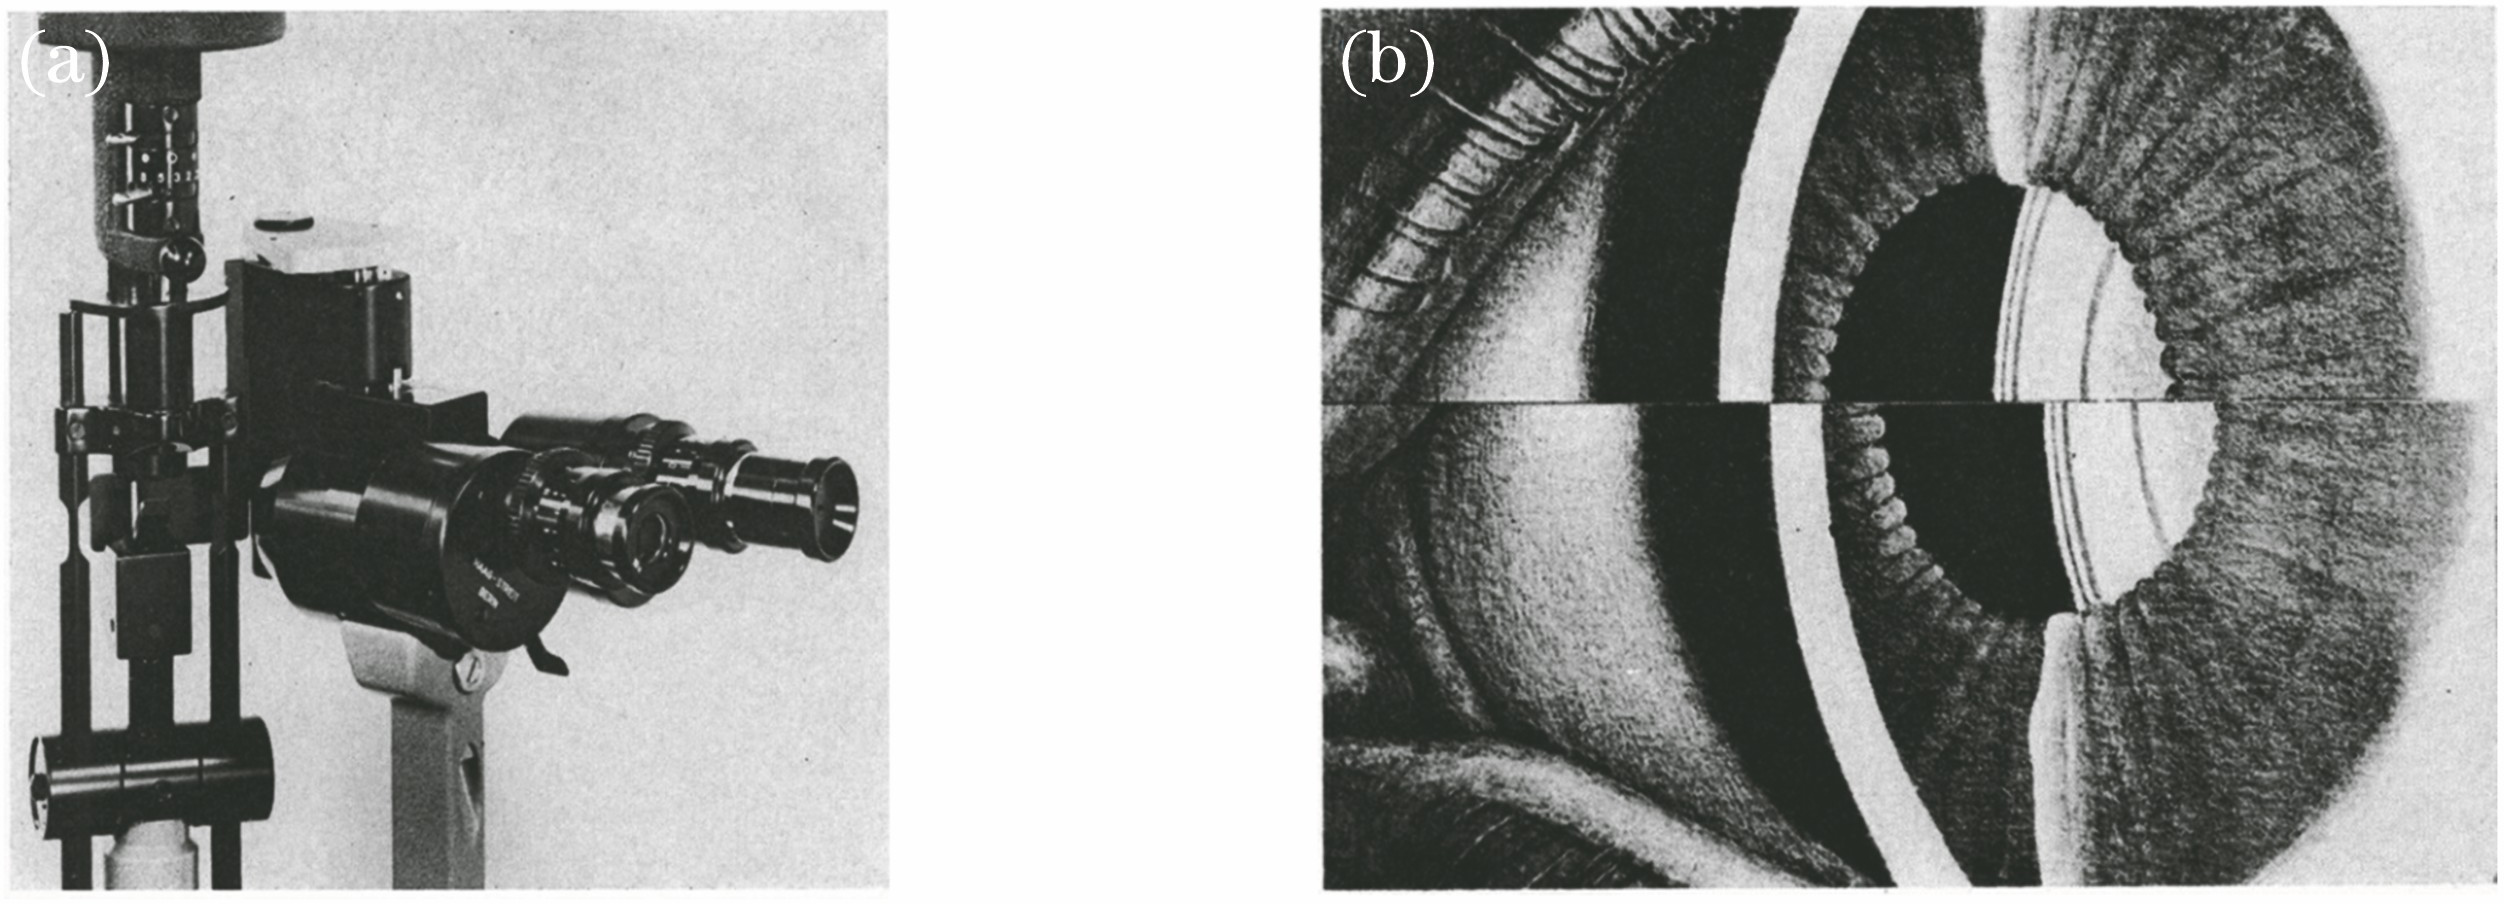

图 3. 串联扫描共聚焦显微镜(TSCM)。(a)光路示意图,来自宽带光源(1)的光穿过尼普科夫圆盘(2)和分束器(3)一侧的针孔,并通过物镜(4)聚焦到样品(5)。信号被分束器(3)和前表面镜(6)反射到圆盘另一侧的共轭针孔,从而阻止来自待测样品以外的光信号到达相机或目镜。旋转圆盘可实时、均匀地对样品进行扫描[57];(b) TSCM物镜的简化示意图,演示如何通过移动内部透镜来改变焦平面的深度或z向位置[62]
Fig. 3. Tandem scanning confocal microscope (TSCM). (a) Illustration of the optical pathway used in TSCM. Light from a broadband source (1) passes through the pinholes on one side of a Nipkow disk (2) and a beam splitter (3), and is focused by an objective (4) into the specimen (5). The signal is then reflected by the beam splitter (3) and front surface mirror (6) to the conjugate pinholes on the opposite side of the disk, which prevents light outside the sample to be measured from reaching a camera or

图 4. 两种方法的测量实例[33]。(a)裂隙断层扫描结果,左上为角膜前表面,右上为后表面,左下为轴向曲率,右下为厚度;(b)圆锥角膜患者的Scheimpflug测厚图
Fig. 4. Examples of measurements by two methods[33]. (a) Results of slit tomography: anterior elevation (upper left), posterior elevation (upper right), axial curvature (lower left), and thickness (lower right); (b) Scheimpflug pachymetry map of a patient with keratoconus

图 5. 使用SD-OCT进行体内眼前节成像[72]。(a) SD-OCT系统示意图。SLD:超辐射发光二极管;C:准直器;NPBS:非偏振分束器;VDF:可调密度滤光片;M:参考镜;GS: xy扫描振镜;OL:物镜;S:样品;DAQ:数据采集卡;SMF:单模光纤;DG:衍射光栅;CL:相机镜头;LSC:线扫描相机;FGC:帧捕捉卡;(b)人体眼前节体内测量结果
Fig. 5. In vivo anterior eye segment imaging with SD-OCT[72]. (a) Diagram of SD-OCT system. SLD, super luminescent diode; C, collimator; NPBS, nonpolarizing beam splitter; VDF, variable density filter; M, reference mirror; GS, xy galvanometer scanner; OL, objective lens; S, sample; DAQ, data acquisition card; SMF, single-mode fiber; DG, diffraction grating; CL, camera lens; LSC, line scan camera; FGC, frame grabber card; (b)in vivo m

图 6. 共焦拉曼光谱法评估角膜水合的结果图[15]。(a)观测到暴露于环境(温度:23 ℃,相对湿度:70%)的完整兔角膜轴向水分布的典型变化;(b)通过超声测厚仪和共焦拉曼光谱法分别测量的角膜中央厚度和角膜水合度与脱水时间的函数对比情况
Fig. 6. Evaluated results by the corneal hydration based on confocal Raman spectroscopy[15]. (a) Typical changes observed in the axial water distribution in an intact rabbit cornea exposed to the ambient environment (temperature is 23 °C, and relative humidity is 70%); (b) central corneal thickness and corneal hydration measured by ultrasound pachymetry and confocal Raman spectroscopy as functions of dehydration time

图 7. NIRA的主要测量结果图[16]。(a1)角膜基质脱水过程中原始吸收光谱随时间的变化情况;(b1)在t 为 0 s,270 s和540 s的吸收光谱,与图7 (a1)对应; (c1)与图7 (a1)对应的5185.4 cm-1和6897.2 cm-1两处吸收峰的归一化吸光度变化;(a2)为消除散射效应对吸收谱进行基线校正后,角膜基质脱水期间水吸收峰归一化吸光度随时间的变化;(b2)在t为0 s,270 s和540 s的吸收光谱,与图7 (a2)对应,最小吸光度被校正为0;(c2)与图7 (a2)对应的5185.4 cm-1<
Fig. 7. Main measurement results of NIRA[16]. (a1) Changes in original absorption spectra over time during corneal stroma dehydration; (b1) absorption spectra at t=0 s, 270 s, and 540 s, corresponding to Fig. 7 (a1); (c1) change in normalized absorbance for absorption peaks at 5185.4 cm-1 and 6897.2 cm-1 corresponding to Fig. 7 (a1) ; (a2) change in norma


图 10. 太赫兹角膜成像实验[18]。(a)离体角膜组织THz成像和光谱测量实验示意图;(b)离体猪角膜的THz成像图,角膜中水的质量分数依次为84.74%,78.64%,75.27%,70.25%和66.06%
Fig. 10. THz corneal imaging experiment[18]. (a) Experimental diagram of THz imaging and spectroscopy for ex vivo corneal tissues; (b) THz images of ex vivo porcine cornea at mass fraction of 84.74%, 78.64%, 75.27%, 70.25%, and 66.06% of water

图 11. 太赫兹光谱测量实验结果[18]。 (a) 0.25,0.45,0.65,0.85,1.05 THz处反射率与角膜含水量的关系;(b) THz反射率与含水量的斜率同THz频率的关系
Fig. 11. Results of THz spectrum measurement experiment[18]. (a) THz reflectivity versus water content in cornea at 0.25, 0.45, 0.65,0.85, and 1.05 THz;(b) relationship between THz reflectivity, water content, and THz frequency

图 12. 4个在体兔角膜的THz反射率与超声测厚仪测量外推的含水量之间的关系[19]
Fig. 12. THz reflection versus extrapolated water content obtained by ultrasound pachymetry in four in vivo rabbit corneas[19]

图 13. 角膜太赫兹反射率的体内测量结果[20]。(a) 45岁男子,不戴眼镜;(b) 26岁男子,戴眼镜
Fig. 13. Results of corneal THz reflectivity obtained by in vivo measurements[20]. (a) 45 year-old man, not wearing glasses; (b) 26 year-old man, wearing glasses

图 14. 5只兔眼模型的部分THz反射率水合成像图[22]。每组左上角图像中的虚线圆表示超声探头的位置
Fig. 14. Partial images of THz reflectivity hydration imaging for all five rabbit models[22]. Dotted circles overlaid on the top left cornea of each image denote the ultrasound probe location

图 15. 用于角膜成像的太赫兹实验光路[23]。(a)系统设计;(b)黄铜球作为待测目标相对于平面镜位置的图像;(c)将THz图像通过算法重新映射以获得相应的目标表面图像
Fig. 15. THz experimental optical path for corneal imaging[23]. (a) System design; (b) image of brass ball used as target to be measured with respect to planar mirror position; (c) re-mapping of THz image by algorithm to obtain corresponding target surface image

图 16. 非接触式体内人角膜成像[25]。(a)位于成像系统前的志愿者;(b)志愿者眼睛的拍摄照片,其中虚线框表示近似的视场(FOV);(c1)(d1)(e1) t=0,3,6 min时的成像结果;(c2)(d2)(e2)图16 (c1),(d1),(e1)的正视图
Fig. 16. Noncontact in vivo human corneal imaging[25]. (a) Volunteer positioned in front of the imaging system; (b) image of volunteer's eye with approximate FOV denoted by the dotted contour; (c1)(d1)(e1) imaging results at t=0, 3, and 6 min; (c2)(d2)(e2) en face views of Figs. 16 (c1), (d1), and (e1)

图 17. 实验装置及结果[26]。(a)实验设置示意图;(b)时间域中的参考信号;(c)频率域中的参考信号;(d)在脱水过程中隐形眼镜的失水量可表示为时间的函数
Fig. 17. Experimental setup and results[26]. (a) Schematic of experimental setup; (b) reference signal in time domain; (c) reference signal in frequency domain; (d) water loss of the contact lens during the dehydration process is shown as a function of time

图 18. 实验建立的模型[26]。(a)半-无穷厚模型和拟合后的结果与实际测量结果的对比;(b)厚度可变模型和拟合后的结果与实际测量结果的对比;(c)分层复合电介质模型,板块颜色越深代表含水量的递增
Fig. 18. Models built in this experiment[26]. (a) Semi-infinite thickness model and comparison between fitting results and measured results; (b) variable-thickness model and comparison between fitting results and measured results; (c) layered composite dielectric model. Darker slabs represent increasing water content

图 19. 多个时间点下模拟得到的反射信号(红线)与实际测量样品的反射信号(黑线)[26]
Fig. 19. Simulated reflection signals (red) and measured reflection signals (black) at different time[26]

图 20. 实验设置示意图与误差修正前后的对比。(a)实验所使用的THz-TDS系统[27];(b)太赫兹反射光路与样品支架[28];(c)其中一个样品在误差修正前与修正后不同含水量的反射光谱[28]
Fig. 20. Schematic of experimental setup and spectrum comparison between with and without error correction. (a) THz-TDS system for experiment[27]; (b) terahertz reflection light path and sample holder[28]; (c) reflection spectra of a sample before and after error correction under different water content[28]

图 21. 称重法和基于时间延迟进行估算的结果对比[28]。(a)角膜1;(b)角膜2;(c)角膜3;(d)角膜4
Fig. 21. Comparison of results between weighing method and time delay based estimation[28]. (a) Cornea1; (b) cornea2; (c) cornea3; (d) cornea4


表 1商用眼前节OCT平台[33]
Table1. Commercially available anterior eye segment OCT platforms[33]
|
表 2本研究结果与其他已发表研究结果的对比
Table2. Comparison of results between this paper and other published studies
|
王森德, 姚嘉丽, 胡俊波, 刘晓庆, 林列, 刘永基, 刘伟伟. 角膜含水量光学测量方法研究综述[J]. 激光与光电子学进展, 2020, 57(17): 170001. Sende Wang, Jiali Yao, Junbo Hu, Xiaoqing Liu, Lie Lin, Yongji Liu, Weiwei Liu. Review of Optical Measurement Methods for Corneal Water Content[J]. Laser & Optoelectronics Progress, 2020, 57(17): 170001.


 PDF全文
PDF全文

