Accelerating ions with high-energy short laser pulses from submicrometer thick targets  Download: 1008次
1 GSI Helmholtzzentrum fur Schwerionenforschung GmbH, Planckstra?e 1, 64291 Darmstadt, Germany
2 Helmholtz Institut Jena, Fr¨obelstieg 3, 07743 Jena, Germany
3 Institut fur Kernphysik, Technische Universitat Darmstadt, Schlossgartenstra?e 9, 64289 Darmstadt, Germany
4 Institute for Theoretical Physics, Frankfurt University, Max-von-Laue-Str. 1, 60438 Frankfurt am Main, Germany
Figures & Tables
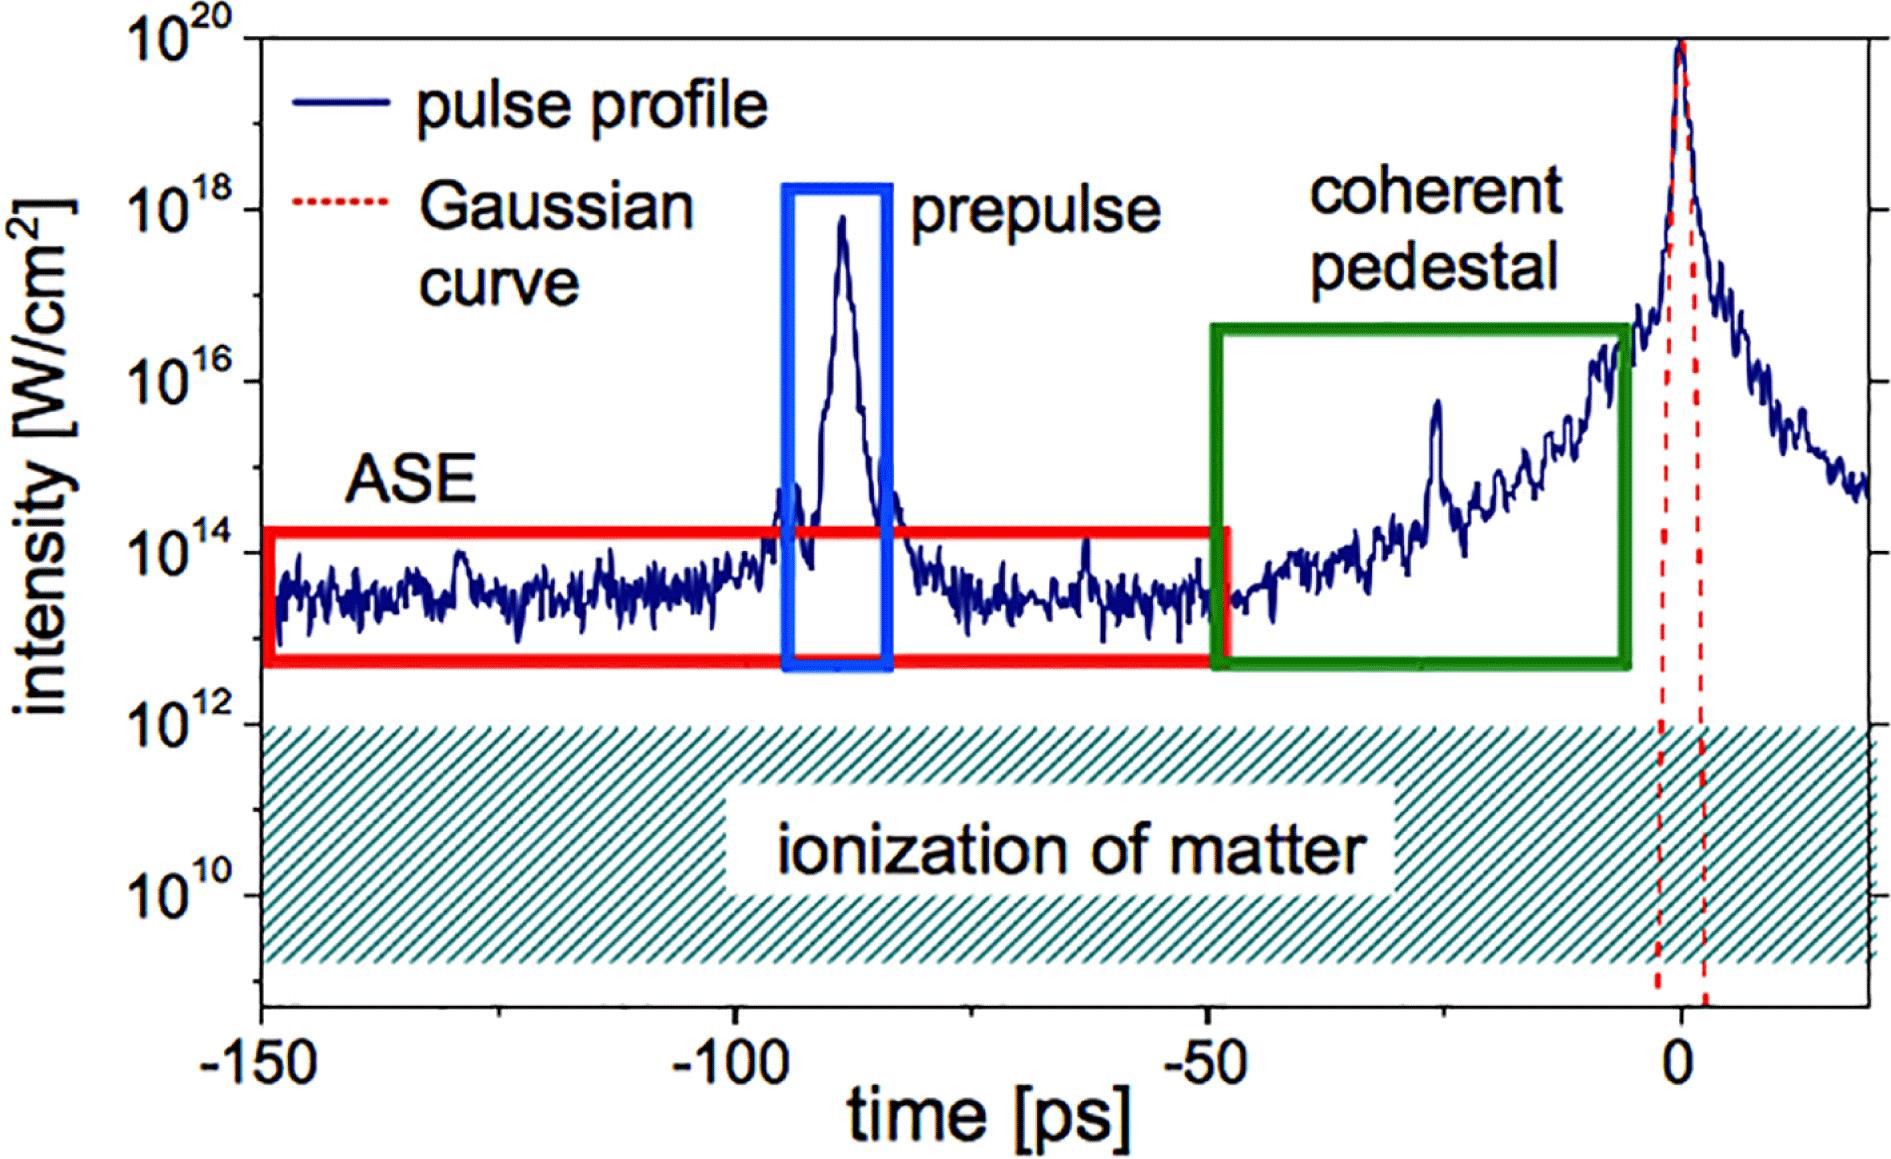
Fig. 1. Temporal profile of the PHELIX pulse in 2010 before the application of pulse cleaning techniques, measured with a third order cross-correlator (Sequoia, Amplitude Technologies). The curve has been scaled to a peak intensity of $10^{20}~\text{W}~\text{cm}^{-2}$. The shaded area illustrates the ionization threshold for typical target materials. The red dashed line shows a Gaussian function with the same FWHM as the pulse (blue).
下载图片 查看原文
Fig. 2. Simulated electron density for two different ASE levels.
下载图片 查看原文
Fig. 3. Schematic of the PHELIX short pulse beamline.
下载图片 查看原文
Fig. 4. Temporal profile of the PHELIX pulse in 2012 using the uOPA with a gain of $10^{4}$. The pulse was measured with a third order cross-correlator (Sequoia, Amplitude Technologies). The right graph shows an enlargement of the red framed region of the left graph.
下载图片 查看原文
Fig. 5. Temporal profile of the PHELIX pulse in November 2015 using the uOPA with a gain of $10^{5}$. The pulse was measured with a third order cross-correlator (Sequoia, Amplitude Technologies).
下载图片 查看原文
Fig. 6. Schematical setup of the focus and target alignment system. (a) The laser focus is imaged on the camera while the target is moved to the side. A transparent target is mapped on the camera by transmitting the light from the LED inside the target chamber through the target. (b) For alignment of opaque targets the LED light is coupled into the diagnostics beamline using a beamsplitter cube and light coming back from the target is imaged onto the camera.
下载图片 查看原文
Fig. 7. (a) Image of a micrometer thick plastic target attached to a thicker supporting foil with a free aperture of 1 mm. (b) Image of the focal spot.
下载图片 查看原文
Fig. 8. Selection of RCF which were exposed to laser-accelerated proton beams. The energy of protons which are fully stopped in the particular foil are written underneath each layer. Shown are examples for: (a) a shot with a ns-prepulse with a contrast ratio around $10^{6}$, (b) a shot after removing the prepulse and (c) a shot using the full aberration control.
下载图片 查看原文
Table1. Results from 2D particle in cell simulations. The TNSA maxima are the cutoff energies which are obtained with $1~\unicode[STIX]{x03BC}\text{m}$ thick plastic targets which stay opaque during the interaction. The BOA maxima are the cutoff energies obtained with the given optimum target thicknesses. Targets with these thicknesses are relativistically transparent when the pulse maximum impacts the target.
| Intensity | TNSA maxima | BOA maximum | Optimum target |
|---|
| [MeV] | [MeV] | thicknesses [nm] |
|---|
| 1 | 53 | 135 | 60 | | 2 | 72 | 160 | 96 | | 3 | 92 | 264 | 128 |
|
查看原文
Table2. Pulse parameters of the PHELIX short pulse.
| | | | | |
|---|
| ($200\pm 10$ J) | ($750\pm 250$ fs) | ($3.7\pm 0.3~\unicode[STIX]{x03BC}\text{m}$) | $0.8\pm 0.1$ | $0.25\pm 0.05$ | $0.62\pm 0.24$ |
|
查看原文
F. Wagner, C. Brabetz, O. Deppert, M. Roth, T. Stohlker, An. Tauschwitz, A. Tebartz, B. Zielbauer, V. Bagnoud. Accelerating ions with high-energy short laser pulses from submicrometer thick targets[J]. High Power Laser Science and Engineering, 2016, 4(4): 04000e45.


 PDF全文
PDF全文

