纳秒激光熔覆硅纳米薄膜的仿真分析及实验研究  下载: 1188次
Simulation Analysis and Experimental Study on Nanosecond Laser Cladding Silicon Nano Film
1 南京航空航天大学机电学院, 江苏 南京 210016
2 盐城工学院机械工程学院, 江苏 盐城 224051
图 & 表
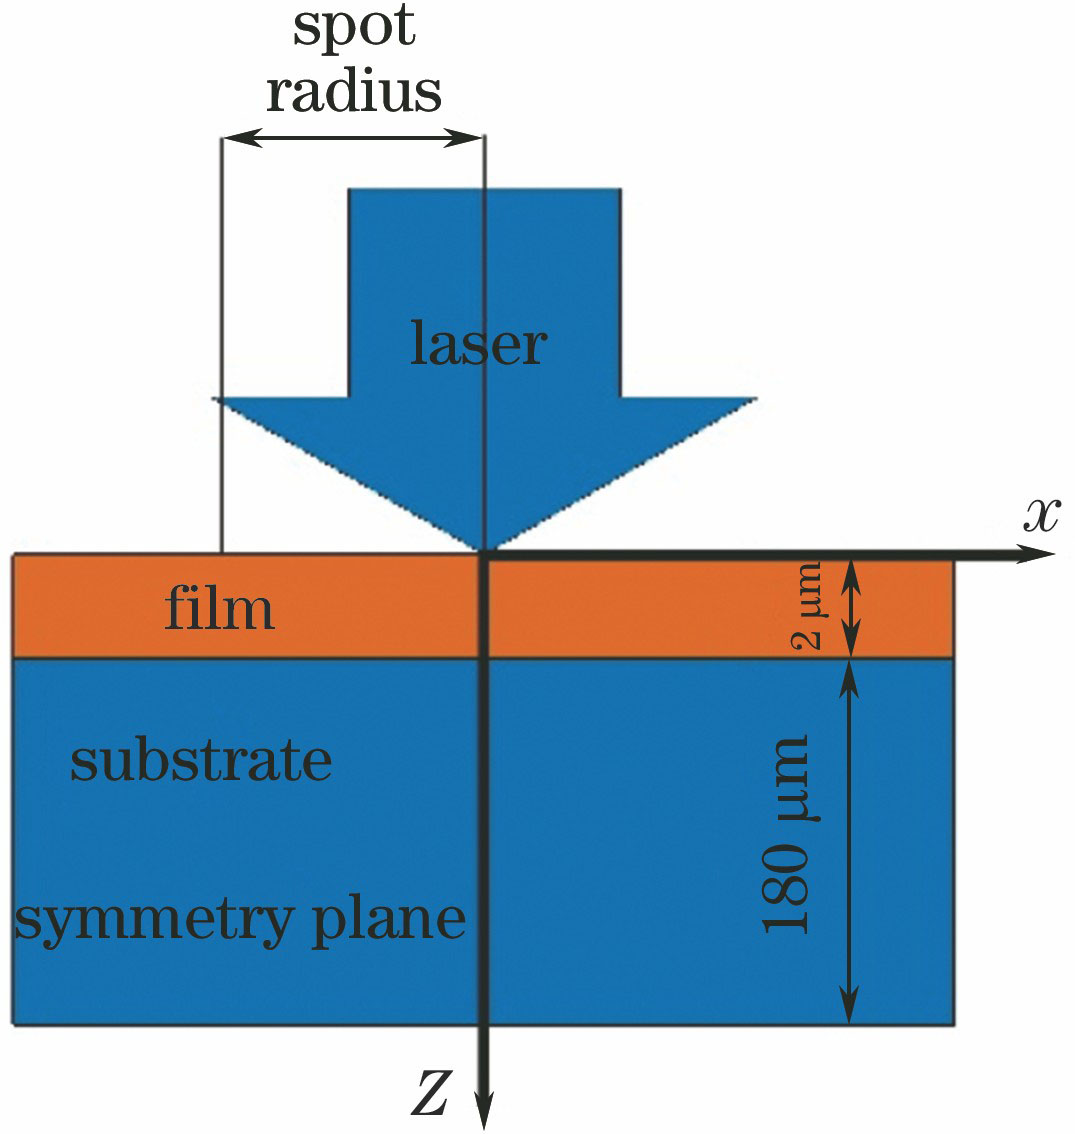
图 1. 纳秒激光熔覆示意图
Fig. 1. Schematic of nanosecond laser cladding
下载图片 查看原文
图 2. 数值模拟模型
Fig. 2. Numerical simulation model
下载图片 查看原文
图 3. t=700 ns时三维温度场的分布图
Fig. 3. Distribution map of three-dimensional temperature field when heat transfer time is 700 ns
下载图片 查看原文
图 4. 节点位置示意图
Fig. 4. Sketch map of node position
下载图片 查看原文
图 5. 节点温度随时间的变化
Fig. 5. Variation of node temperature with time
下载图片 查看原文
图 6. 不同功率下的温度场分布图(t=700 ns)。(a) P=10 W;(b) P=18 W;(c) P=26 W;(d) P=30 W
Fig. 6. Temperature fields at different powers (t=700 ns). (a) P=10 W; (b) P=18 W; (c) P=26 W; (d) P=30 W
下载图片 查看原文
图 7. 基体重熔深度与熔池深度示意图
Fig. 7. Diagram of matrix remelting depth and molten pool depth
下载图片 查看原文
图 8. 激光功率对熔覆层几何尺寸的影响
Fig. 8. Effect of laser power on size of cladding layer
下载图片 查看原文
图 9. 不同功率下基体重熔深度与熔池深度之比
Fig. 9. Ratio of matrix remelting depth to melting depth at different powers
下载图片 查看原文
图 10. 不同扫描速率下的温度场分布(t=700 ns)。(a) 4 m·s-1;(b) 10 m·s-1;(c) 12 m·s-1;(d) 16 m·s-1
Fig. 10. Temperature fields at different scanning speeds. (a) 4 m·s-1; (b) 10 m·s-1; (c) 12 m·s-1; (d) 16 m·s-1
下载图片 查看原文
图 11. 不同扫描速率下的熔覆层几何尺寸
Fig. 11. Size of cladding layer at different scanning speeds
下载图片 查看原文
图 12. 不同扫描速率下的基体重熔深度与熔池深度之比
Fig. 12. Ratio of matrixremelting depth to melting depth at different scanning speeds
下载图片 查看原文
图 13. 不同重复频率下的温度场分布图。(a) 200 kHz;(b) 300 kHz;(c) 350 kHz;(d) 400 kHz
Fig. 13. Temperature fields at different repetition rates. (a) 200 kHz; (b) 300 kHz; (c) 350 kHz;(d) 400 kHz
下载图片 查看原文
图 14. 不同重复频率下的熔覆层几何尺寸
Fig. 14. Size of cladding layer at different repetition rates
下载图片 查看原文
图 15. 不同重复频率下的基体重熔深度与熔池深度之比
Fig. 15. Ratio of matrix remelting depth to melting depth at different repetition rates
下载图片 查看原文
图 16. 制备实验组电池和参照组电池的工艺方案
Fig. 16. Process programs of SY-PERC cell and BSL-PERC cell
下载图片 查看原文
图 17. 硅浆料在硅基体上印刷并烘干后的硅片实物图
Fig. 17. Silicon wafer after printing silicon paste and drying
下载图片 查看原文
图 18. 激光熔覆后实验组硅片的表面形貌
Fig. 18. Surface topography of experimental wafer after laser cladding process
下载图片 查看原文
图 19. 硅基体打开钝化膜后的表面形貌
Fig. 19. Surface topography of silicon substrate after laser opening passivation layer
下载图片 查看原文
表 1用于数值模拟的基体材料的属性
Table1. Properties of basis material used in numerical simulation
| Material properties | Value |
|---|
| Thermal conductivity[20-21]k /(W·m-1·K-1) | 1.585×10⁵T-1.23(solid);125(liquid) | | Heat capacity[20-21]cp /(J·kg-1·K-1) | 1.978×10⁶+3.54×10²T-3.68×10⁶T2(solid);1000(liquid) | | Density[b]ρ /(kg·m-3) | 2330(solid);2520(liquid) | | Melting point Tm /K | 1685 | | Boiling point Tv /K | 3538 | | Phase transition interval ΔT /K | 50 | | Reflectivity[22]R | 0.374(solid);0.73(liquid) |
|
查看原文
表 2工艺参数影响因素的水平值
Table2. Horizontal value of technological parameter influence factors
| No. | Laserpower /W | Scanningspeed /(m·s-1) | Repetitionrate /kHz | h/H |
|---|
| 1 | 20 | 10 | 400 | 0.385 | | 2 | 20 | 12 | 300 | 0.432 | | 3 | 20 | 14 | 350 | 0.422 | | 4 | 24 | 10 | 300 | 0.531 | | 5 | 24 | 12 | 350 | 0.495 | | 6 | 24 | 14 | 400 | 0.446 | | 7 | 28 | 10 | 350 | 0.530 | | 8 | 28 | 12 | 400 | 0.502 | | 9 | 28 | 14 | 300 | 0.551 |
|
查看原文
表 3极差分析结果
Table3. Range analysis
| Factor | h/H | Range |
|---|
| Level 1 | Level 2 | Level 3 |
|---|
| Laser power /W | 0.413 | 0.491 | 0.528 | 0.115 | | Scanning speed /(m·s-1) | 0.482 | 0.476 | 0.473 | 0.009 | | Repetition rate /kHz | 0.505 | 0.482 | 0.444 | 0.061 |
|
查看原文
表 4激光熔覆实验工艺参数
Table4. Laser cladding process parameters
| Experiencegroup | Laserpower /W | Scanningspeed /(m·s-1) | Repetitionrate /kHz |
|---|
| 1 | 28 | 10 | 350 | | 2 | 28 | 14 | 300 | | 3 | 24 | 12 | 350 |
|
查看原文
表 5不同实验组下熔覆层深度与宽度的测量值与仿真值
Table5. Measured and simulated depth and width of cladding layer in different experimental groups
| Sample | Experimental group 1 | Experimental group 2 | Experimental group 3 |
|---|
| Depth /μm | Width /μm | Depth /μm | Width /μm | Depth /μm | Width /μm |
|---|
| Measured value (average) | 4.31 | 18.52 | 4.10 | 22.13 | 3.58 | 21.76 | | Simulation value | 4.526 | 20.218 | 4.450 | 25.440 | 3.963 | 25.137 |
|
查看原文
表 6参照组电池和实验组电池的电学性能参数
Table6. Electrical performance parameters of BSL-PERC and SY-PERC cells
| Cell group | Voc /V | FF /% | Eta /% | Rs /(Ω·m-2) |
|---|
| SY-PERC | 0.6679 | 80.58 | 21.56 | 0.0019 | | BSL-PERC | 0.6639 | 80.41 | 21.50 | 0.0023 |
|
查看原文
徐龙, 洪捐, 汪炜. 纳秒激光熔覆硅纳米薄膜的仿真分析及实验研究[J]. 中国激光, 2019, 46(4): 0402008. Long Xu, Juan Hong, Wei Wang. Simulation Analysis and Experimental Study on Nanosecond Laser Cladding Silicon Nano Film[J]. Chinese Journal of Lasers, 2019, 46(4): 0402008.


 PDF全文
PDF全文

