光学学报, 2019, 39 (8): 0801002, 网络出版: 2019-08-07
基于卷积神经网络的大气中光路气流扰动实验研究  下载: 1376次
Atmospheric Optical Path Airflow Disturbance Analysis Method Based on Convolutional Neural Network
图 & 表
图 1. 受湍流影响的空间光光束示意图。(a) D?L;(b) D?L
Fig. 1. Schematic of space beam affected by turbulence. (a) D?L; (b) D?L
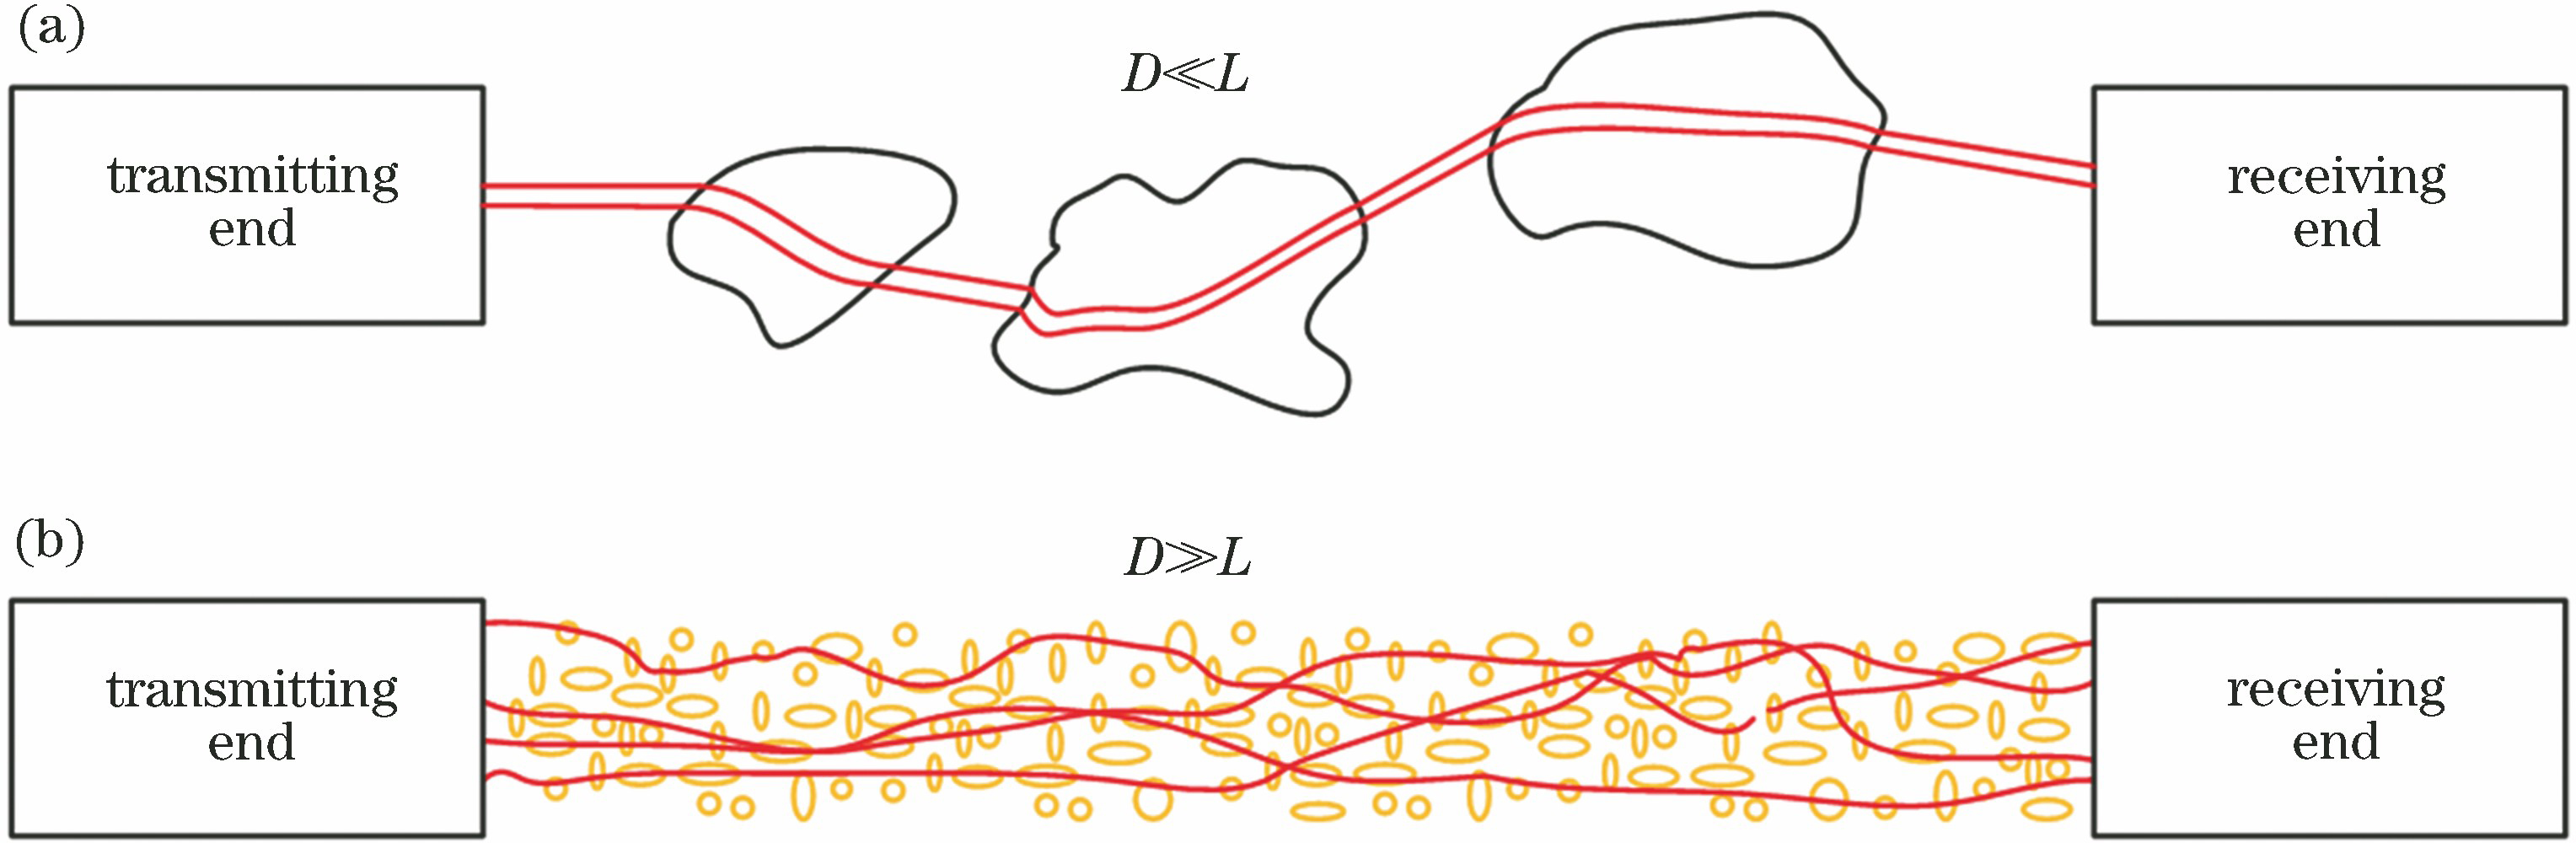
图 2. 基于光斑畸变和CNN模型的湍流研究原理图
Fig. 2. Schematic of turbulence analysis based on spot distortion and CNN model


图 5. 光束受到气流扰动时的远场光斑图案演化,对应风速大小为(a)小于5 km/h;(b)约10 km/h;(c)约15 km/h;(d)大于20 km/h
Fig. 5. Far-field spot evolution when the beam propagation is affected by the turbulence. Corresponding wind speed: (a) below 5 km/h; (b) near 10 km/h; (c) near 15 km/h; (d) over 20 km/h

图 6. 基于阈值的图像主要部分提取流程。(a)原图;(b)灰度图;(c)二值轮廓图;(d)原图边界确定;(e)背景裁剪后的图像
Fig. 6. Extraction process of main part of the image based on threshold. (a) Original image; (b) gray-scale image; (c) binary image; (d) image border; (e) image after background removed

图 7. 压缩到32 pixel×32 pixel的光斑图案。(a)弱湍流;(b)强湍流
Fig. 7. Beam spot patterns compressed to 32 pixel×32 pixel. (a) Weak turbulence; (b) strong turbulence


图 9. 弱湍流,强湍流,及中等强度湍流扰动下的光斑及三维能量分布。(a)(b)(c)光斑;(d)(e)(f)三维能量分布
Fig. 9. Light spot pattern and three-dimensional energy distribution under weak turbulence, strong turbulence, and moderate-intensity turbulence disturbances. (a)(b)(c) Light spot; (d)(e)(f) three-dimensional energy distribution

图 10. 连续测量的约500组光斑图案数据的评估情况。(a) 0~500 s;(b) 0~40 s
Fig. 10. Evaluation of near 500 continuously measured beam spot image data. (a) 0-500 s; (b) 0-40 s

图 11. 风速仪数据与CNN模型计算结果对比。(a)风速仪测量风速每16 s平均值与最大值比较;(b) CNN模型结果计算值P2 16 s平滑前后
Fig. 11. Comparisons between anemometer data and CNN model calculation results. (a) Comparison of the average and maximum wind velocity data from the anemometer every 16 s; (b) calculated values of CNN model results before and after 16 s smoothing

图 12. 两测量风速和评估值P2的比较。(a) 2018年9月18日;(b) 2018年9月22日
Fig. 12. Comparison between wind speed and evaluation value P2. (a) On 18th September, 2018; (b) on 22nd September, 2018


表 1CNN方法与传统质心法的比较
Table1. Comparison between CNN-based method and traditional gravity center-based method
|
刘一琛, 吴侃, 邱高峰, 陈建平. 基于卷积神经网络的大气中光路气流扰动实验研究[J]. 光学学报, 2019, 39(8): 0801002. Yichen Liu, Kan Wu, Gaofeng Qiu, Jianping Chen. Atmospheric Optical Path Airflow Disturbance Analysis Method Based on Convolutional Neural Network[J]. Acta Optica Sinica, 2019, 39(8): 0801002.


 PDF全文
PDF全文

