High Power Laser Science and Engineering, 2020, 8 (1): 010000e7, Published Online: Mar. 27, 2020
Hydrodynamic computational modelling and simulations of collisional shock waves in gas jet targets  Download: 662次
Figures & Tables
Fig. 1. Simulation of the spherical expansion of the blast wave (left) and the lineout (red line) of the steep density walls at the front of the shock (right) in an homogeneous hydrogen gas, for initial density of $0.5\times 10^{17}~\text{cm}^{-3}$ and 1 mJ absorbed energy of the BNL $\text{CO}_{2}$ laser.
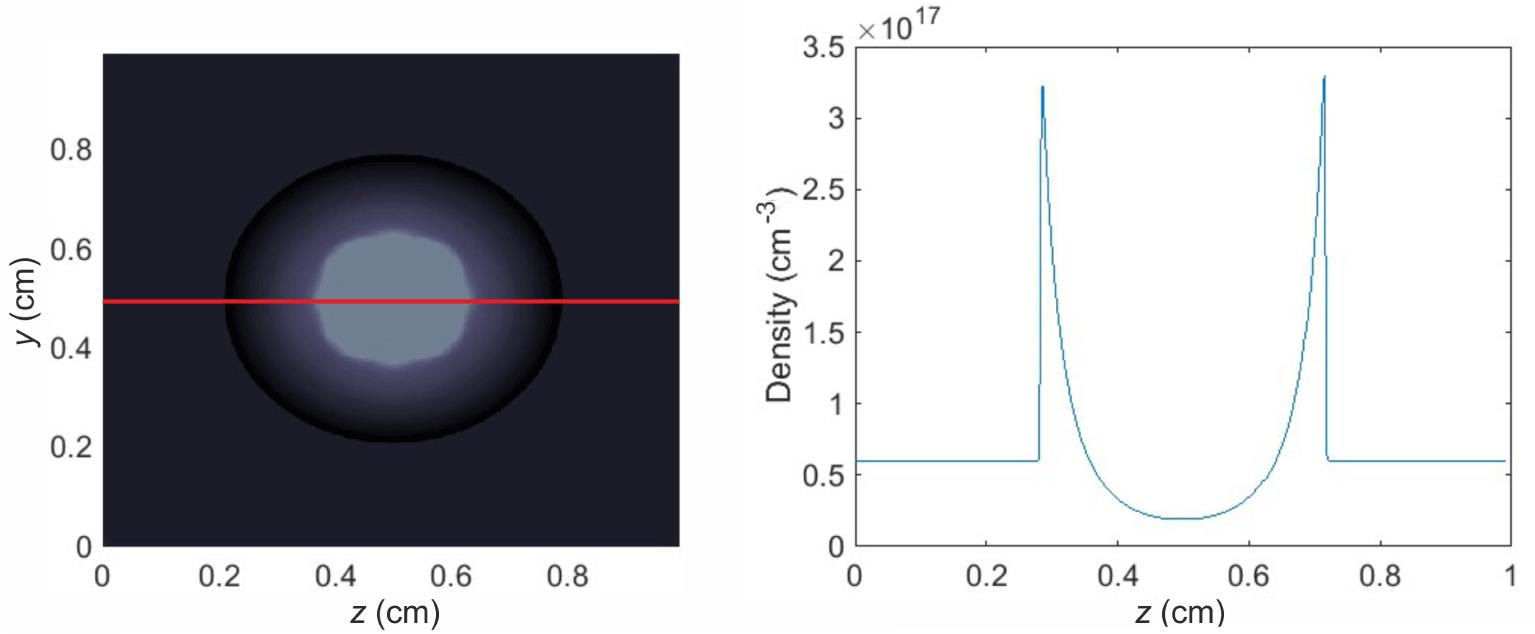
Fig. 2. Time evolution of density profiles along the laser propagation axis for a blast wave at $t=0,1,12$ and 20 ns, corresponding to the BNL $\text{CO}_{2}$ laser, at 4 bar initial pressure and absorbed energy 20 mJ. The laser beam is focused at $z=-0.02~\text{cm}$ .

Fig. 3. Left: the cylinder where the energy is deposited, representing the confocal volume of the laser pulse with $w_{0}=35~\unicode[STIX]{x03BC}\text{m}$ and $Z_{R}=374~\unicode[STIX]{x03BC}\text{m}$ . At $t=0$ , the beam is focused at $z=-0.06~\text{cm}$ along the laser propagation axis ($z$ -axis) along the direction of the gas flow ($y$ -axis). Right: the formation of the blast wave at $t=4~\text{ns}$ corresponding to the $\text{CO}_{2}$ specifications, at 4 bar initial pressure and absorbed energy 100 mJ, deposited at $z=-0.02~\text{cm}$ .

Fig. 4. The triangular density shape used in the simulation (blue) and the initial energy deposition (red), for $w_{0}=35~\unicode[STIX]{x03BC}\text{m}$ , $Z_{R}=374~~\unicode[STIX]{x03BC}\text{m}$ and $E_{\text{abs}}=10~\text{mJ}$ .

Fig. 5. The profiles of backing pressures of 4, 5 and 6 bar (maximum) that correspond to the molecular densities of $n=3.39\times 10^{18}~\text{cm}^{-3}$ , $n=4.42\times 10^{18}~\text{cm}^{-3}$ and $n=5.09\times 10^{18}~\text{cm}^{-3}$ , respectively.

Fig. 6. Comparison of the FLASH and self-similar Sedov results for 20 mJ absorbed energy, for initial density $n=3.39\times 10^{18}~\text{cm}^{-3}$ , deposited at 0.02 cm prior to the centre of the throat.

Fig. 7. The blast wave radii (left) and the corresponding ratio of the peak electron density to the critical density (right). Time evolution up to 20 ns for 1, 5, 20 and 100 mJ absorbed energy deposited at $z=0.1~\text{cm}$ prior to the centre of the throat. Initial density was set to $n=3.39\times 10^{18}~\text{cm}^{-3}$ .

Fig. 8. The blast wave radii (left) and the corresponding ratio of the peak electron density to the critical density (right). Time evolution up to 20 ns for 1, 5, 20 and 100 mJ absorbed energy deposited at 0.02 cm prior to the centre of the throat. Initial density was set to $n=3.39\times 10^{18}~\text{cm}^{-3}$ .

Fig. 9. The density scale lengths versus time (left) and blast wave radii length (right), for density of $n=4.42\times 10^{18}~\text{cm}^{-3}$ and absorbed energies of 5, 20 and 100 mJ.

Fig. 10. The blast wave radii (left) and the corresponding ratio of peak electron density to the critical density (right). Time evolution up to 15 ns for 5, 50, 100, 250, 500 and 1000 mJ absorbed energies, deposited at 0.05 cm prior to the centre of the throat. Initial density was set to $n=4.52\times 10^{20}~\text{cm}^{-3}$ .


Stylianos Passalidis, Oliver C. Ettlinger, George S. Hicks, Nicholas P. Dover, Zulfikar Najmudin, Emmanouil P. Benis, Evaggelos Kaselouris, Nektarios A. Papadogiannis, Michael Tatarakis, Vasilis Dimitriou. Hydrodynamic computational modelling and simulations of collisional shock waves in gas jet targets[J]. High Power Laser Science and Engineering, 2020, 8(1): 010000e7.


 PDF全文
PDF全文

