Photonics Research, 2018, 6 (7): 07000713, Published Online: Jul. 4, 2018
Parametric amplification of Rydberg six- and eight-wave mixing processes
Figures & Tables
Fig. 1. (a) Five-level K -type energy level diagram depicting the generation of the MWM process in the Rb 85 atomic system. (b) Experimental setup. D, photodetector; L, lens; PBS, polarized beam splitter at corresponding wavelength; FD, frequency doubler; HR, high-reflectivity mirror; HW, half-wave plate at corresponding wavelength. Transverse double-headed arrows and filled dots indicate the horizontal polarization and vertical polarization of incident beams, respectively. Five beams derived from the four laser systems are coupled into the 10 mm long Rb cell wrapped with μ-metal sheets. The transition | 0 ⟩ ↔ | 1 ⟩ is coupled by the beam E 1 (780.2 nm). Rydberg transition | 1 ⟩ ↔ | 2 ⟩ is coupled by beam E 2 (480 nm), which counterpropagates with beam E 1 . | 1 ⟩ ↔ | 3 ⟩ is connected by beams E 3 and E 3 ′ (780.2 nm), which are derived from the same ECDL, and | 1 ⟩ ↔ | 4 ⟩ is coupled by beam E 4 (775.9 nm). The EIT signal and MWM spectrum signals are received by D1 and D2, respectively. (c1) Energy schematic diagram for SP-FWM process; (c2) phase-matching condition of SP-FWM process.
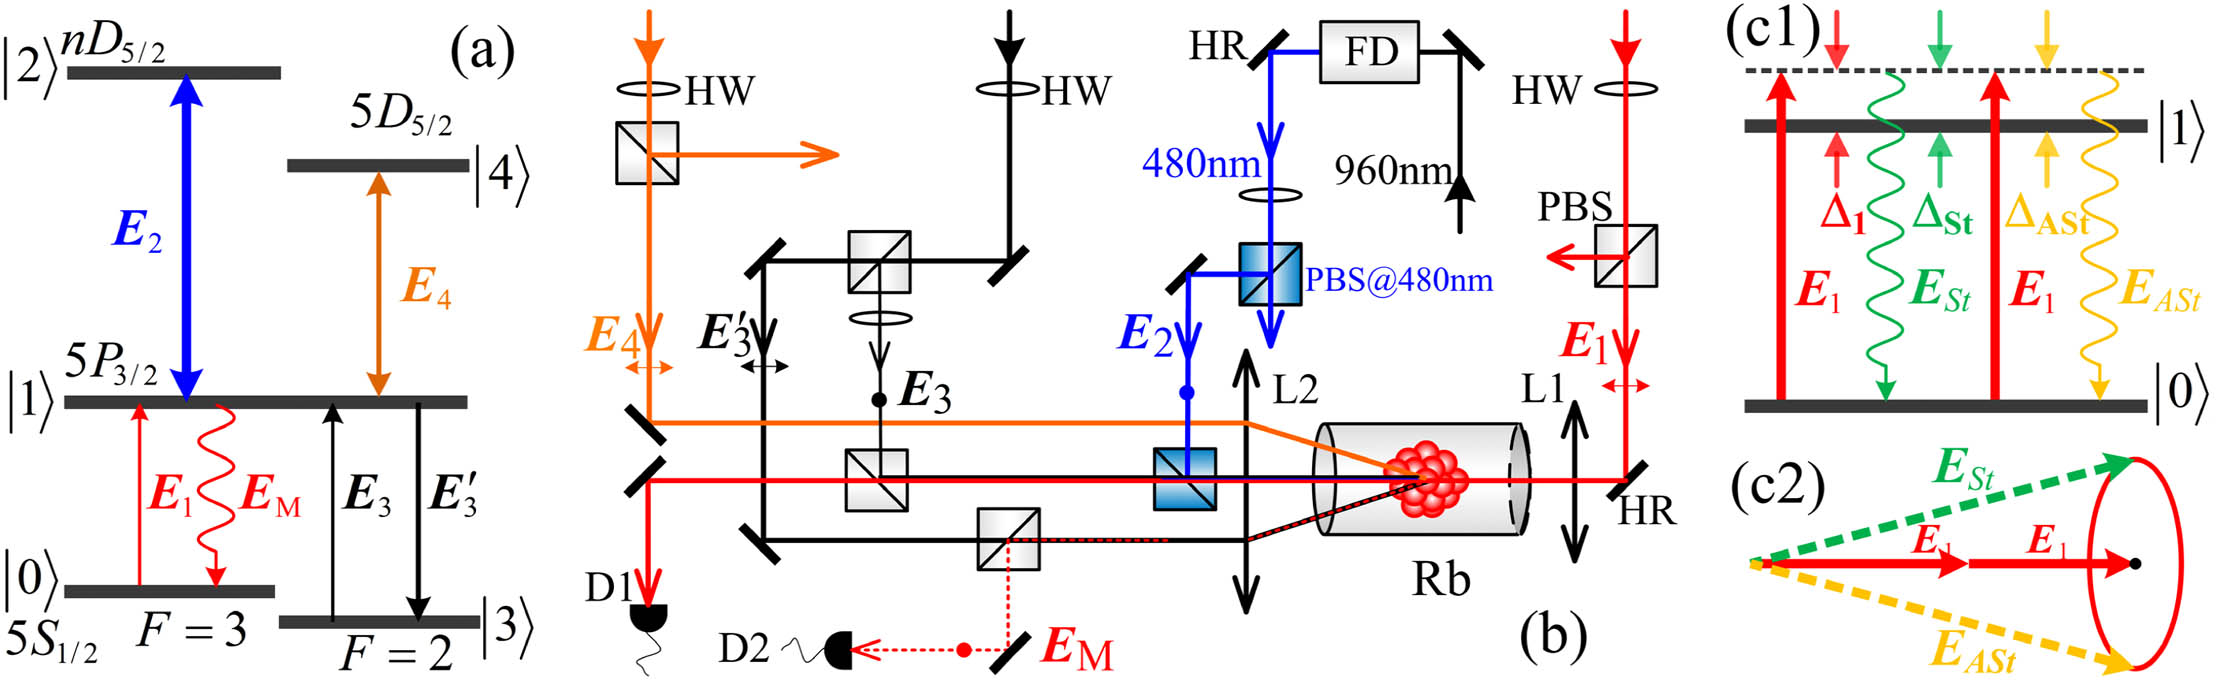
Fig. 2. (a1) Phase-matching diagram of the OPA process with E SWM 1 injected into the Stokes port. (a2) Measured Stokes field E St and (a3) anti-Stokes field E ASt versus Δ 1 ; (b1) and (b2) intensity of PA-SWM2 signals transited from n D 5 / 2 versus Δ 1 at different Δ 2 for n = 37 and n = 54 , respectively; (c1) and (c2) intensity of PA-SWM2 signals transited from fine structure of energy level n D 3 / 2 versus Δ 1 at different Δ 2 for n = 37 and n = 54 , respectively; (d1) PA-SWM1 signals (denoted as blue triangles) versus Δ 1 at different Δ 4 (Δ 1 + Δ 4 = 0 ); (d2) PA-SWM2 signals transited from 37 D 5 / 2 (denoted as black squares) and 54 D 3 / 2 (denoted as red circles) versus Δ 1 at different Δ 2 (Δ 1 + Δ 2 + ϵ = 0 ).
Fig. 3. (a1) Measured PA-SWM2 signals versus Δ 2 by increasing P 2 for n = 37 ; (a2) intensity dependence of the PA-SWM2 signals corresponding to (a1) on P 2 ; (b1) measured PA-SWM2 signals versus Δ 2 by changing the temperature for n = 37 ; (b2) intensity dependence of the PA-SWM2 signals corresponding to (b1) on resonant condition on temperature; (b3) theoretically simulated PA-SWM2 signals to (b1). The dots indicate the experimental data, and the solid curve represents the theoretical simulation. The dashed lines are a guide for the eyes.
Fig. 4. (a1) AT splitting in the five-level atomic system induced by E 2 and E 4 ; (a2) phase-matching diagram of OPA injected with E SWM 1 , E SWM 2 , and E EWM into the Stokes port. (b) Measured MWM versus Δ 2 with discrete Δ 4 for n = 37 ; the range of Δ 4 is from − 150 to 150 MHz. (c) Measured MWM signals versus Δ 2 with increasing P 4 for n = 37 ; the range of P 4 is from 10 to 18 mW.
Zhaoyang Zhang, Ji Guo, Bingling Gu, Ling Hao, Gaoguo Yang, Kun Wang, Yanpeng Zhang. Parametric amplification of Rydberg six- and eight-wave mixing processes[J]. Photonics Research, 2018, 6(7): 07000713.