Chinese Optics Letters, 2016, 14 (4): 042201, Published Online: Aug. 6, 2018
Analytical method to measure bending deformations in prismatic optical films  Download: 787次
Figures & Tables
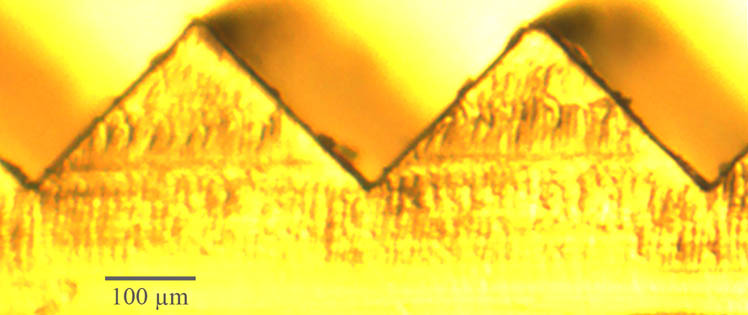
Fig. 2. Edge map (black color) with Hough lines identified (red color) in a prismatic film profile with a curvature of 20 m − 1

Fig. 3. The HT of the three-prism image of a prismatic film curvature of 20 m − 1 ρ θ

Fig. 4. Angle θ m − 1


Fig. 6. Light flux rate (rate of flux lost) scaled from 0 to 1.0 as a function of the curvature of a CPLG for several incidence angles. The graph legend shows incidence angles with regard to the prismatic film flat surface.


Berta García-Fernández, Antonio Álvarez Fernández-Balbuena, Daniel Vázquez-Moliní. Analytical method to measure bending deformations in prismatic optical films[J]. Chinese Optics Letters, 2016, 14(4): 042201.


 PDF全文
PDF全文

