集成微区成像的激光诱导击穿光谱系统的光谱信号稳定性分析  下载: 864次
Spectral Signal Stability of Laser-Induced Breakdown Spectroscopy System Integrated with Micro-Imager
1 中国科学院安徽光学精密机械研究所光子器件与材料安徽省重点实验室, 安徽 合肥 230031
2 中国科学技术大学, 安徽 合肥 230026
图 & 表
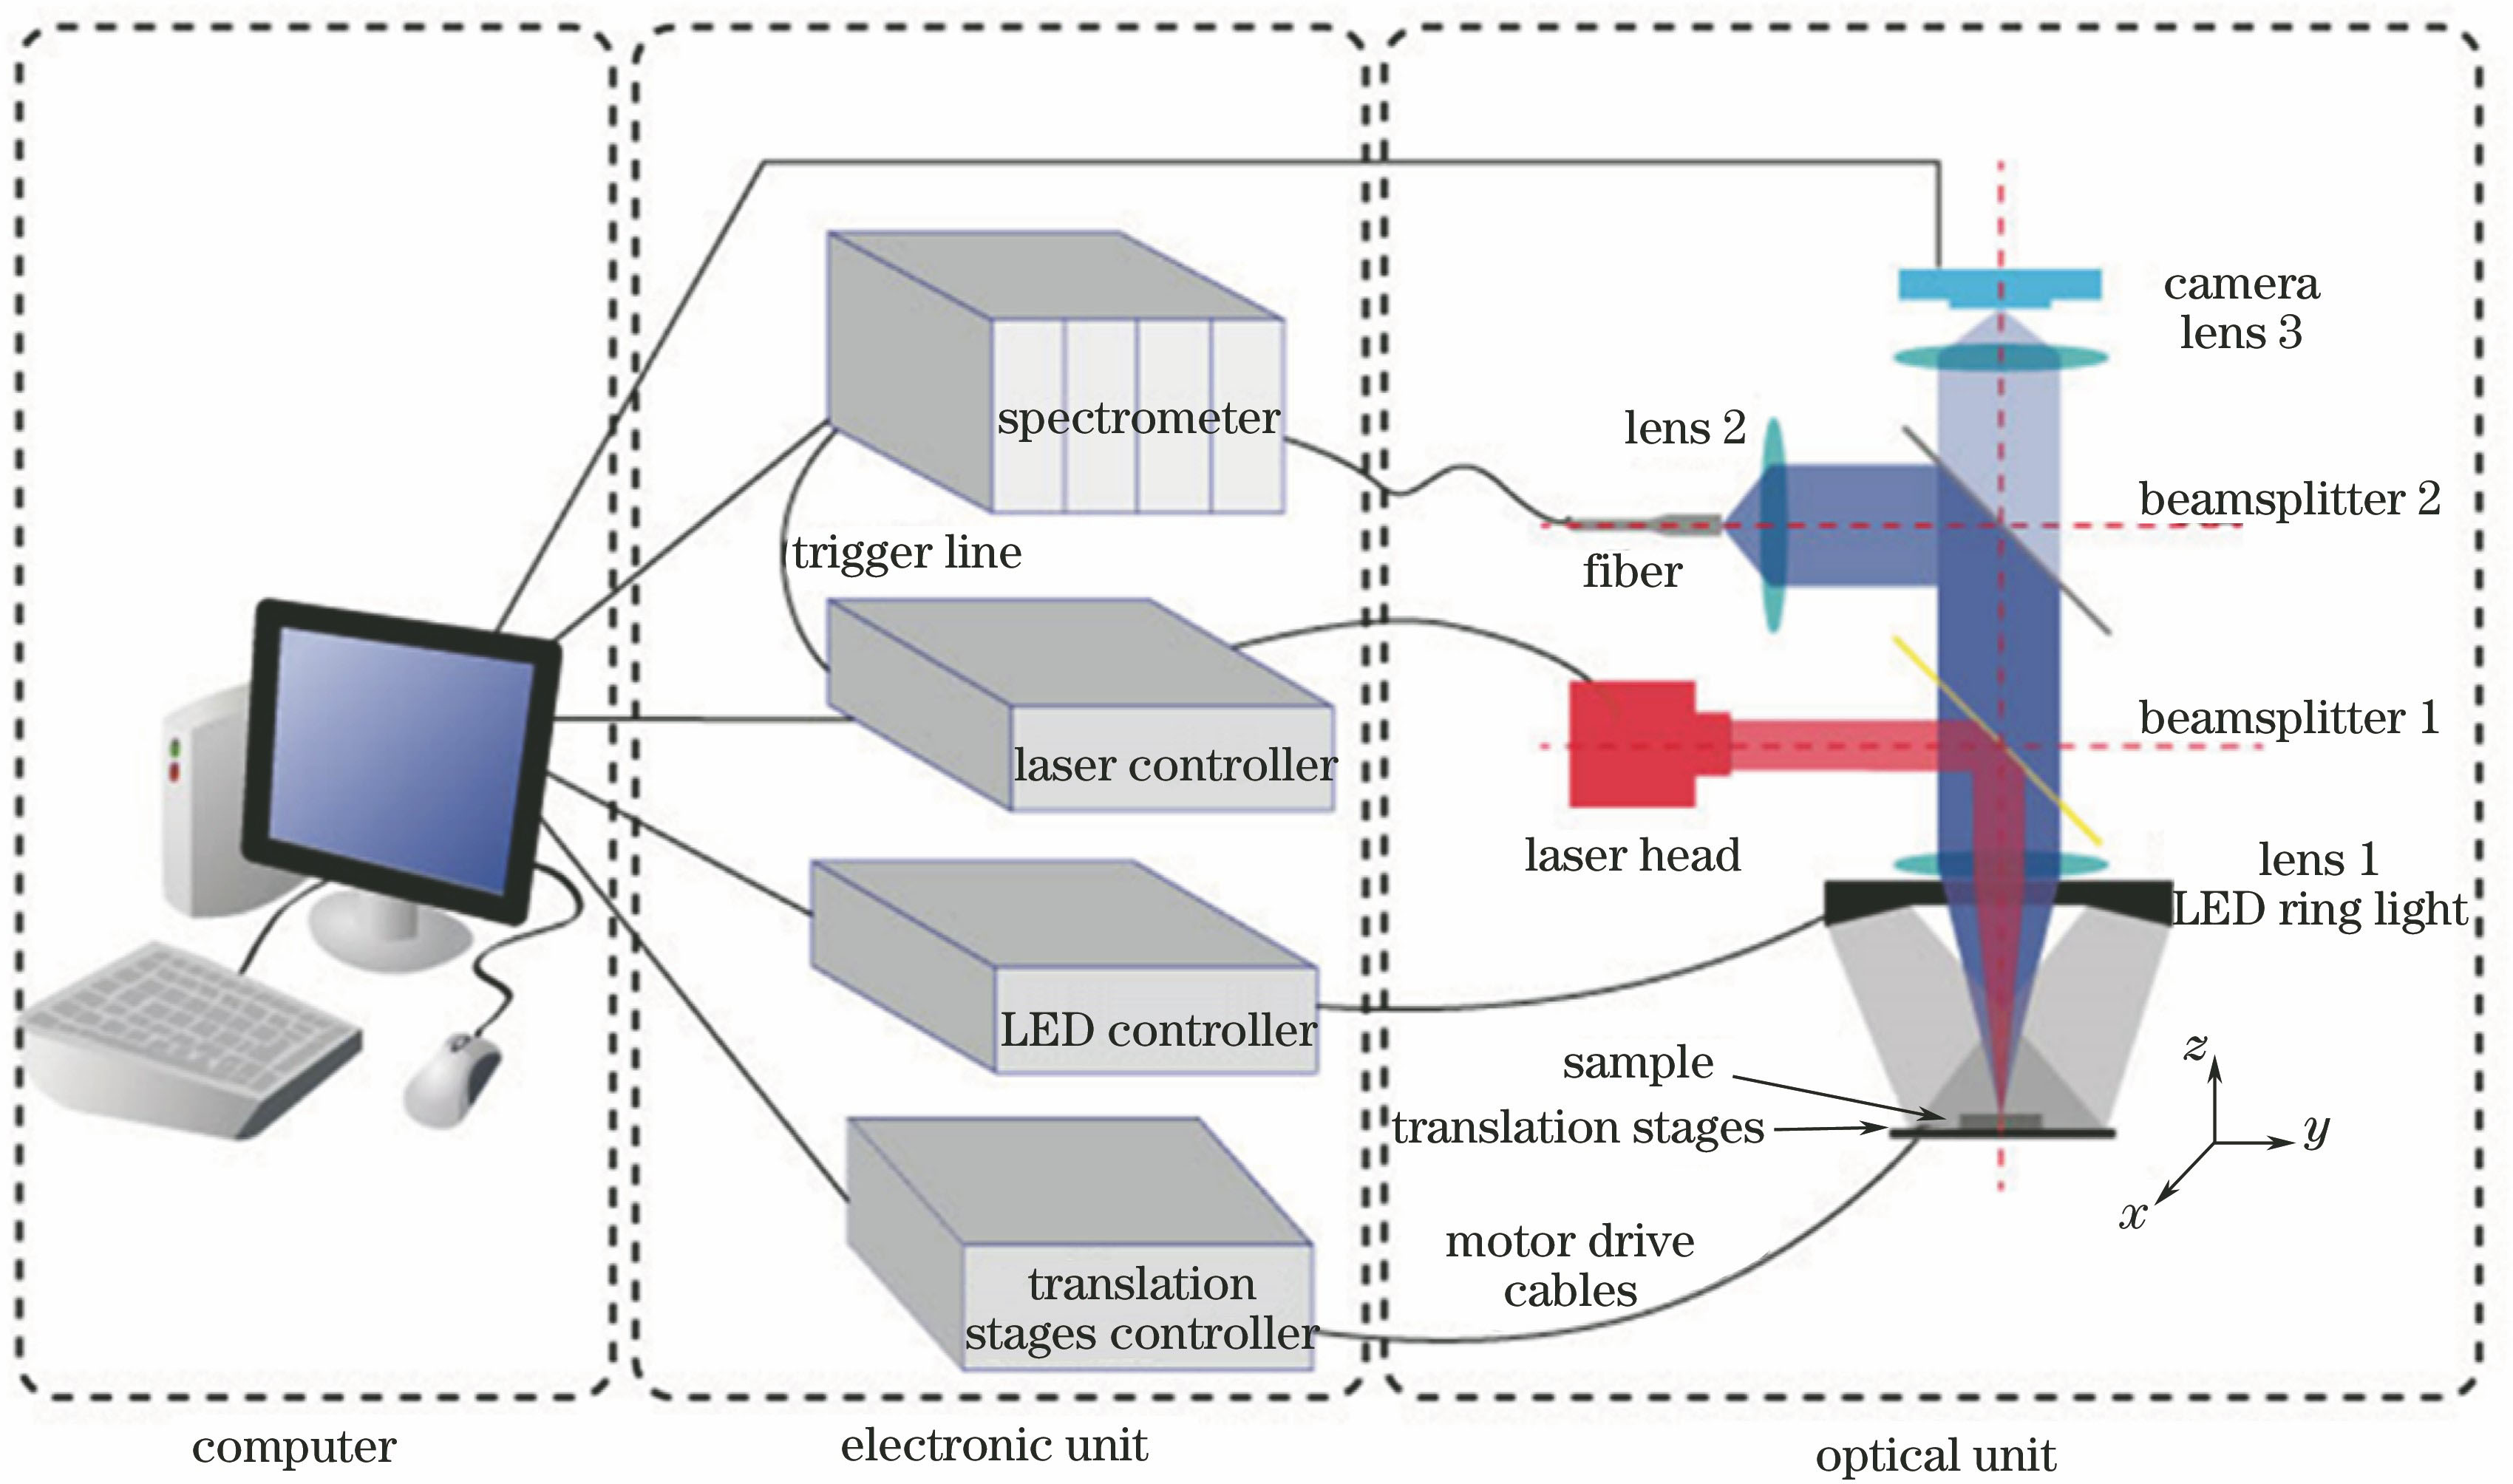
图 1. 实验装置示意图
Fig. 1. Schematic of experimental setup
下载图片 查看原文
图 2. 利用三次样条插值法计算得到的峰值强度
Fig. 2. Peak intensity calculated with cubic spline interpolation
下载图片 查看原文
图 3. 激光器能量的(a)折线图和(b)统计直方图
Fig. 3. (a) Line graph and (b) histogram plot of laser energy
下载图片 查看原文
图 4. 光谱仪暗背景信号的(a)折线图和(b)统计直方图
Fig. 4. (a) Line graph and (b) histogram plot of background signal of spectrometer
下载图片 查看原文
图 5. H原子656.30 nm谱线强度的(a)折线图和(b)统计直方图
Fig. 5. (a) Line graph and (b) histogram plot of intensity f H atomic 656.30 nm spectral line
下载图片 查看原文
图 6. RSD与平均脉冲数之间的关系
Fig. 6. Relationship between RSD and average pulse number
下载图片 查看原文
图 7. 50个脉冲平均后谱线强度与测量顺序的关系
Fig. 7. Relationship between average spectral intensity of 50 pulses and order number
下载图片 查看原文
图 8. 不同样品位置时激光与物质相互作用的示意图
Fig. 8. Diagram of laser-matter interaction at different positions
下载图片 查看原文
图 9. 不同脉冲作用下激光与物质相互作用的示意图
Fig. 9. Diagram of laser-matter interaction under different pulses
下载图片 查看原文
图 10. 不同样品位置时Mg原子谱线强度的(a)折线图与(b)统计直方图
Fig. 10. (a) Line graph and (b) histogram plot of intensity of Mg atomic spectral line at different sample positions
下载图片 查看原文
图 11. 不同样品位置下,1000个脉冲作用后的样品表面激光烧蚀坑图像。(a) 0 mm;(b) 3 mm;(c) 6 mm;(d) 9 mm;(e) 12 mm;(f) 15 mm
Fig. 11. Surface images of laser ablation crater after 1000 pulses at different sample positions. (a) 0 mm; (b) 3 mm; (c) 6 mm; (d) 9 mm; (e) 12 mm; (f) 15 mm
下载图片 查看原文
图 12. 位置12 mm处2次重复实验中谱线强度的边缘直方图
Fig. 12. Marginal histogram of spectral intensity of two repeated experiments at position of 12 mm
下载图片 查看原文
图 13. 50个脉冲平均后,谱线强度与测量顺序间的关系。(a)采样点1;(b)采样点2
Fig. 13. Relationship between average spectral intensity of 50 pulses and order number. (a) Sampling point 1; (b) sampling point 2
下载图片 查看原文
表 1激光器能量的描述性统计结果
Table1. Descriptive statistical results of laser energy
| Mean /mJ | SD /mJ | RSD /% | Minimum /mJ | Q1 /mJ | xmedian /mJ | Q3 /mJ | Maximum /mJ | (Q3-Q1) /mJ | [(Q3-Q1)/xmedian] /% |
|---|
| 35.93 | 0.35 | 0.98 | 33.50 | 35.70 | 35.90 | 36.20 | 37.00 | 0.50 | 1.39 |
|
查看原文
表 2光谱仪背景信号的描述性统计结果
Table2. Descriptive statistical results of background signal of spectrometer
| Mean /mJ | SD /mJ | RSD /% | Minimum /mJ | Q1 /mJ | xmedian /mJ | Q3 /mJ | Maximum /mJ | (Q3-Q1) /mJ | [(Q3-Q1)/xmedian] /% |
|---|
| 16.29 | 41.70 | 256.03 | -100.92 | -11.39 | 12.75 | 39.90 | 198.64 | 51.30 | 402.26 |
|
查看原文
表 3H原子656.30 nm谱线强度的描述性统计结果
Table3. Descriptive statistical results of intensity of H atomic 656.30 nm spectral line
| Mean /mJ | SD /mJ | RSD /% | Minimum /mJ | Q1 /mJ | xmedian /mJ | Q3 /mJ | Maximum /mJ | (Q3-Q1) /mJ | [(Q3-Q1)/xmedian] /% |
|---|
| 12364.51 | 2361.78 | 19.10 | 3809.40 | 11039.74 | 12355.06 | 13576.36 | 26945.38 | 2536.62 | 20.53 |
|
查看原文
表 4Mg原子谱线强度的描述性统计结果(285.21 nm峰值强度)
Table4. Descriptive statistical results of intensity of Mg atomic spectral line (peak value of 285.21 nm)
| Position /mm | Mean /mJ | SD /mJ | RSD /% | Minimum /mJ | Q1 /mJ | xmedian /mJ | Q3 /mJ | Maximum /mJ | (Q3-Q1) /mJ | [(Q3-Q1)/xmedian] /% |
|---|
| 0 | 1415.59 | 479.44 | 33.87 | -34.67 | 1365.74 | 1552.09 | 1675.09 | 5017.22 | 309.35 | 19.93 | | 3 | 1331.95 | 481.66 | 36.16 | 54.34 | 1109.88 | 1363.75 | 1643.57 | 5090.21 | 533.68 | 39.13 | | 6 | 1448.89 | 718.00 | 49.56 | 27.67 | 893.71 | 1369.40 | 1961.92 | 3727.54 | 1068.21 | 78.01 | | 9 | 3269.76 | 1063.20 | 32.52 | 379.67 | 2648.80 | 3084.50 | 3706.89 | 7711.09 | 1058.09 | 34.30 | | 12 | 2612.83 | 759.52 | 29.07 | 70.32 | 2481.32 | 2707.84 | 2969.00 | 6582.26 | 487.68 | 18.01 | | 15 | 1317.60 | 446.43 | 33.88 | 137.67 | 1044.41 | 1376.72 | 1630.25 | 5154.88 | 585.84 | 42.55 |
|
查看原文
王华东, 付洪波, 贾军伟, 周琪琪, 倪志波, 董凤忠. 集成微区成像的激光诱导击穿光谱系统的光谱信号稳定性分析[J]. 中国激光, 2019, 46(3): 0311002. Huadong Wang, Hongbo Fu, Junwei Jia, Qiqi Zhou, Zhibo Ni, Fengzhong Dong. Spectral Signal Stability of Laser-Induced Breakdown Spectroscopy System Integrated with Micro-Imager[J]. Chinese Journal of Lasers, 2019, 46(3): 0311002.


 PDF全文
PDF全文

