光学学报, 2020, 40 (17): 1722004, 网络出版: 2020-08-26
实现给定能量比离散光斑阵列的自由曲面分束器  下载: 1259次封面文章
Freeform Surface Beam Splitter for Discrete Spot Array with Prescribed Energy Proportion
图 & 表
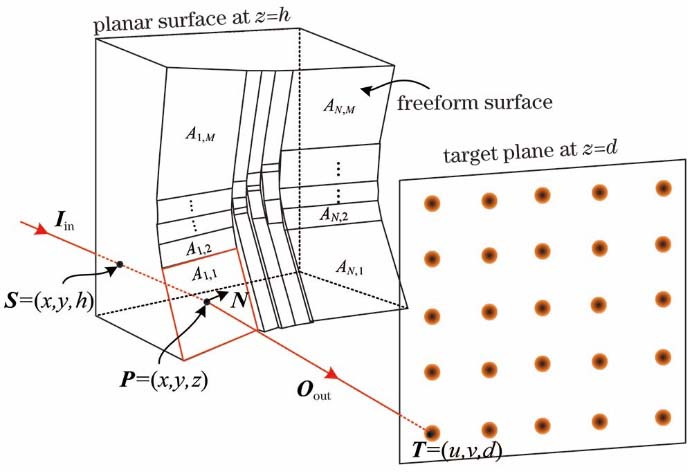

图 3. 从子区域Bn,m到对应光斑区域Ωn,m的光线映射示意图
Fig. 3. Schematic of ray map from subarea Bn,m to corresponding spot area Ωn,m

图 4. 自由曲面数据点与法向矢量的关系示意图
Fig. 4. Schematic of relationships between freeform surface data points and normal vectors


图 6. FBS 1的光线追迹仿真结果。(a)二维光斑阵列;(b)第5列和(c)第1行的中心辐照度分布曲线
Fig. 6. Ray tracing simulation results of FBS 1. (a) 2D spot array; central irradiance profiles of (b) 5th column and (c) 1st row

图 7. FBS 1的物理光学仿真结果。A3,3的仿真光斑(a)真色,(b)假色;A1,1的仿真光斑(c)真色,(d)假色
Fig. 7. Physical optical simulation results of FBS 1. Simulated spot of A3,3 (a) true color, (b) false color; simulated spot of A1,1 (c) true color, (d) false color

图 8. FBS 2的模型、光线追迹和能量比例示意图。(a) FBS 2的模型以及光线追迹的示意图;(b) 目标光斑阵列的能量比例
Fig. 8. FBS 2 model, ray tracing and energy scale diagram. (a) Model of FBS 2 and ray tracing illustration; (b) predefined energy proportion of target spot array

图 9. FBS 2的光线追迹仿真结果。(a) 二维光斑阵列;(b) 第1列,(c) 第2列,(d) 第3列,(e) 第4列,(f) 第5列的中心辐照度分布曲线
Fig. 9. Ray tracing simulation results of FBS 2. (a) 2D spot array; central irradiance profiles of (b) 1st, (c) 2nd, (d) 3rd, (e) 4th, and (f) 5th column

图 10. FBS 2的物理光学仿真结果。A3,3的仿真光斑(a)真色,(b)假色;A1,1的仿真光斑(c)真色,(d)假色
Fig. 10. Physical optical simulation results of FBS 2. Simulated spot of A3,3 (a) true color, (b) false color; simulated spot of A1,1 (c) true color, (d) false color

图 11. FBS 1子曲面的边缘轮廓线及矢高突变曲线。(a) A1和A5;(b) A2和A4;(c) A3;(d)相邻子曲面之间的表面矢高突变曲线
Fig. 11. Edge profiles and sag mutation curves of sub-surfaces of FBS 1. (a) A1 and A5; (b) A2 and A4; (c) A3; (d) sag mutation curves between adjacent sub-surfaces


司佳, 冯泽心, 程德文, 王涌天. 实现给定能量比离散光斑阵列的自由曲面分束器[J]. 光学学报, 2020, 40(17): 1722004. Jia Si, Zexin Feng, Dewen Cheng, Yongtian Wang. Freeform Surface Beam Splitter for Discrete Spot Array with Prescribed Energy Proportion[J]. Acta Optica Sinica, 2020, 40(17): 1722004.


 PDF全文
PDF全文

