Photonics Research, 2017, 5 (3): 03000239, Published Online: Oct. 9, 2018
Direct bandgap photoluminescence from n-type indirect GaInP alloys  Download: 710次
Figures & Tables
Fig. 1. (a) [110]-pole TEM pattern of fully disordered lightly Te-doped Ga 0.74 In 0.26 P n = 7 × 10 16 cm − 3 Ga 0.74 In 0.26 P EPD = ( 3 ± 0.5 ) × 10 6 cm − 2
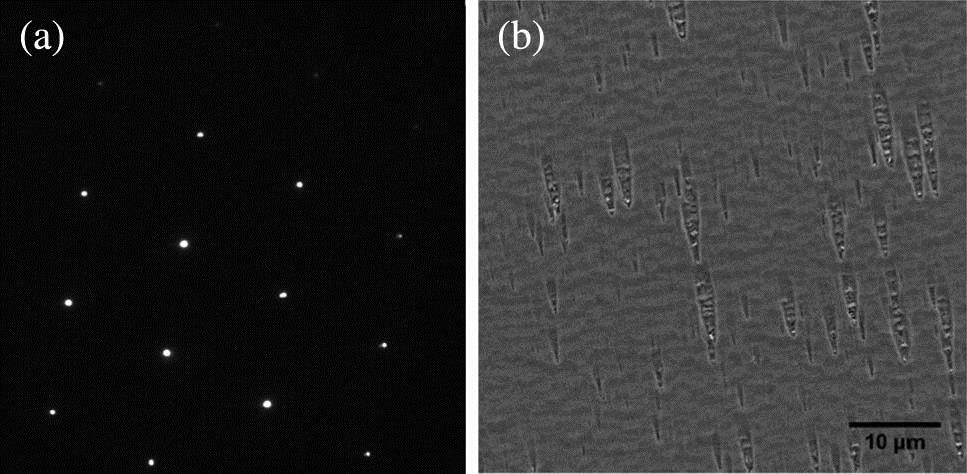
Fig. 2. Temperature-dependent normalized PL spectra (6–300 K) of Te-doped Ga 0.74 In 0.26 P n = 7 × 10 16 cm − 3 n = 9 × 10 17 cm − 3 n = 2 × 10 18 cm − 3 NP x LA x

Fig. 3. Peak positions of Te-doped Ga 0.74 In 0.26 P Γ

Fig. 4. Temperature-dependent PL spectra (175–300 K) of Te-doped Ga 0.74 In 0.26 P n = 7 × 10 16 cm − 3 n = 9 × 10 17 cm − 3 n = 2 × 10 18 cm − 3

Fig. 5. Arrhenius plot of integrated PL intensity versus temperature for Te-doped Ga 0.74 In 0.26 P n = 9 × 10 17 cm − 3 n = 2 × 10 18 cm − 3 E a

Fig. 6. Integrated PL intensity (black squares) of Te-doped Ga 0.74 In 0.26 P


Cong Wang, Bing Wang, Riko I. Made, Soon-Fatt Yoon, Jurgen Michel. Direct bandgap photoluminescence from n-type indirect GaInP alloys[J]. Photonics Research, 2017, 5(3): 03000239.


 PDF全文
PDF全文

