基于深度学习和人眼视觉系统的遥感图像质量评价  下载: 1642次
Quality Assessment of Remote Sensing Images Based on Deep Learning and Human Visual System
航天工程大学电子与光学工程系, 北京 101416
图 & 表
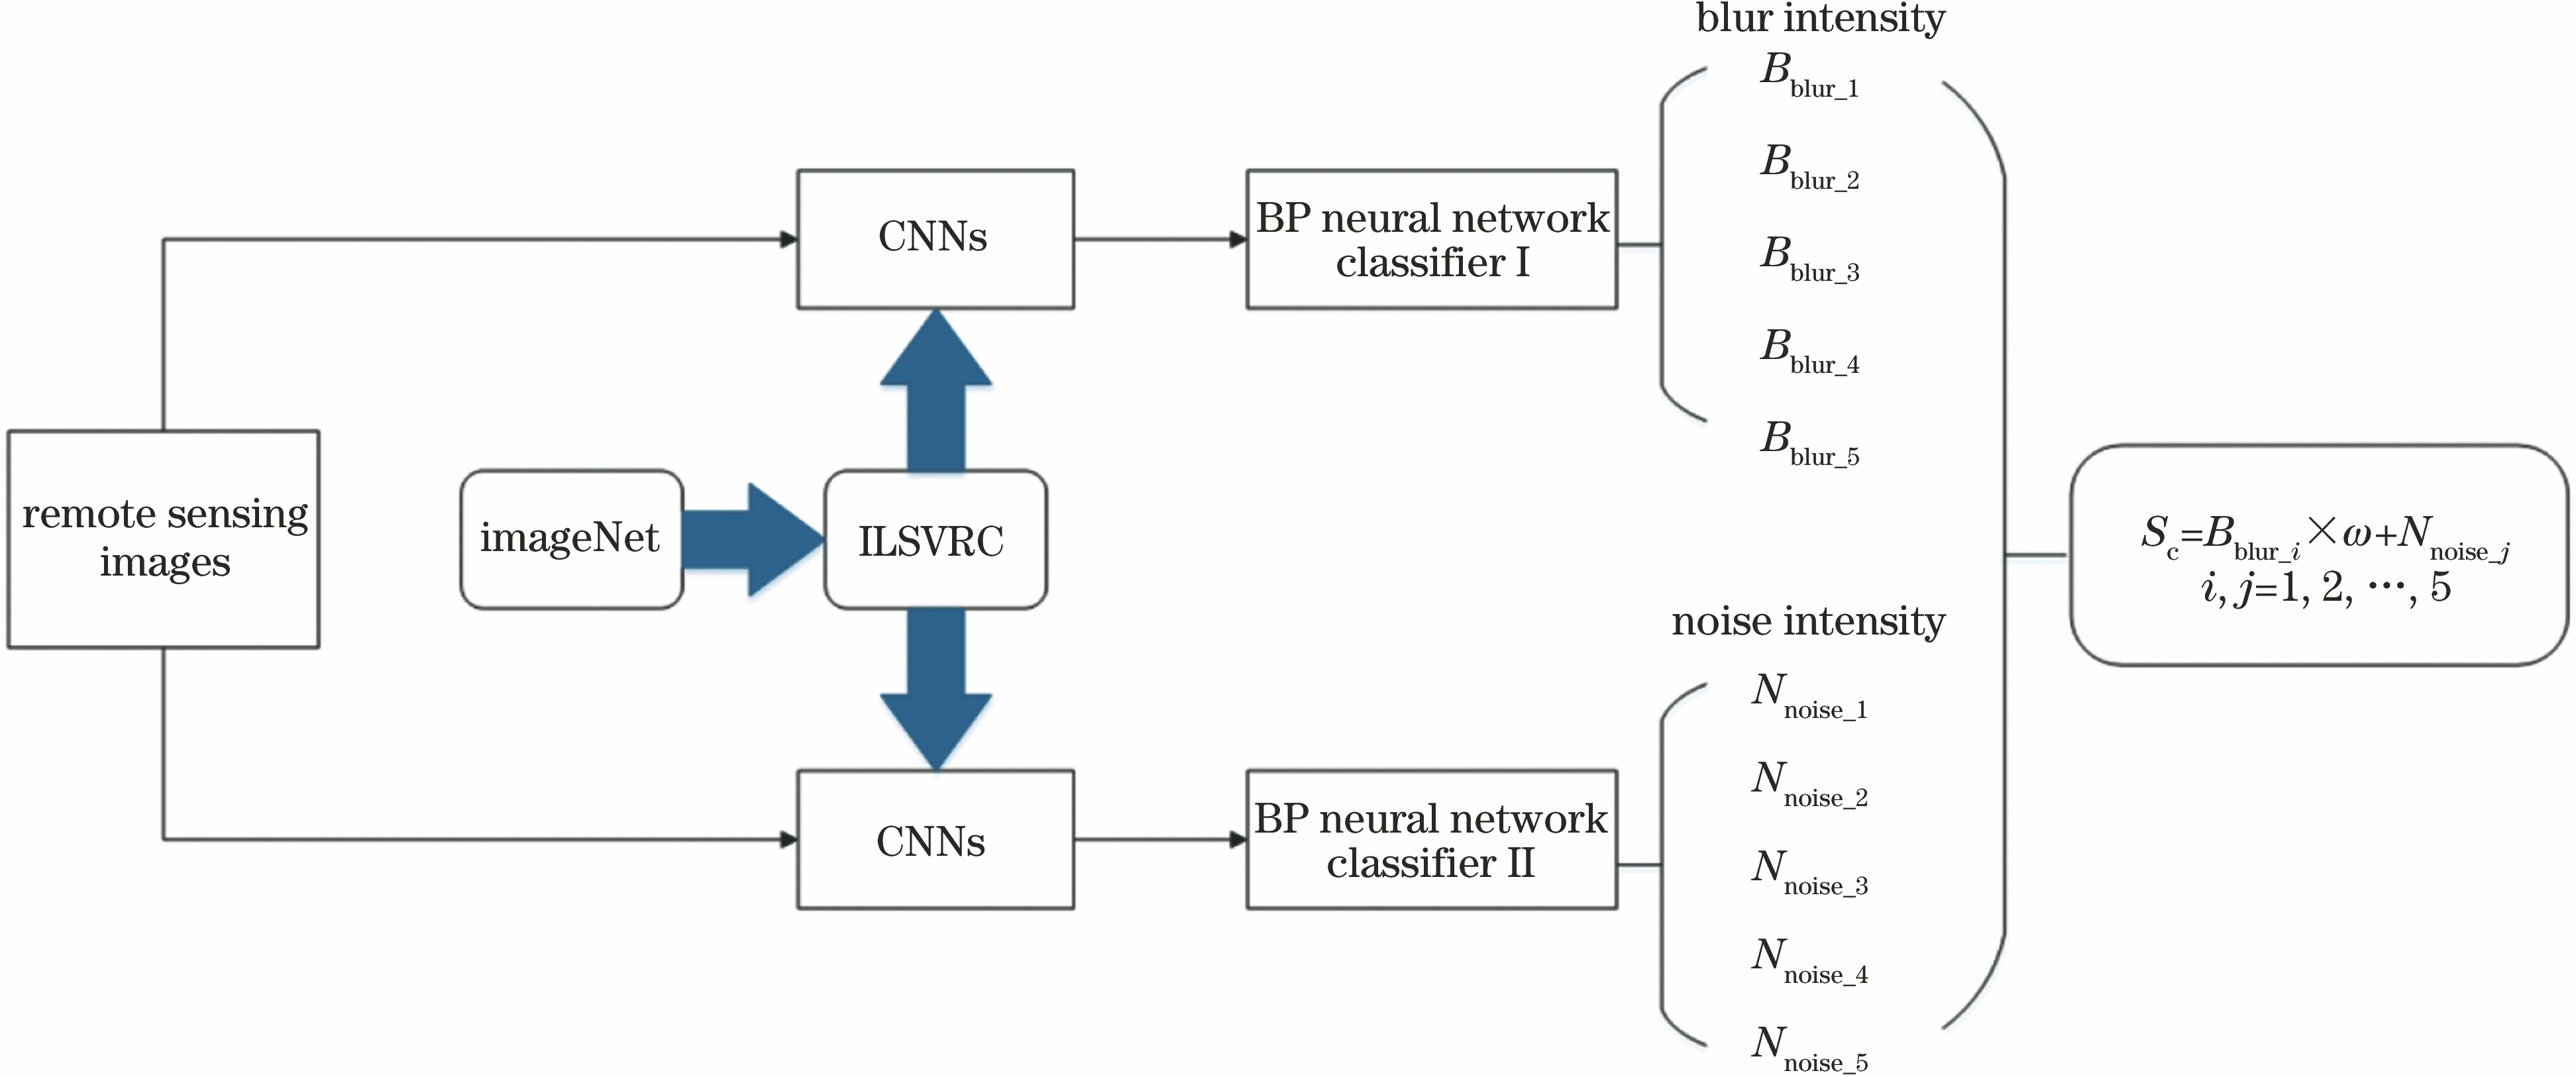
图 1. 评价模型整体结构
Fig. 1. Overall structure of assessment model
下载图片 查看原文
图 2. 基于并行CNN的单路评价框架
Fig. 2. Single-channel assessment framework based on parallel CNN
下载图片 查看原文
图 3. VGG16网络结构
Fig. 3. VGG16 network structure
下载图片 查看原文
图 4. 模糊和噪声对遥感图像视觉特性的影响。(a)原始图像;(b)加入噪声后图像;(c)再加入噪声后图像;(d)模糊后图像;(e)再模糊后图像
Fig. 4. Influences of blur and noise on visual characteristics of remote sensing images. (a) Original image; (b) image with noise; (c) image with noise once more; (d) image with blur; (e) image with blur once more
下载图片 查看原文
图 5. 具有不同纹理复杂度遥感图像。(a) S=9.2784;(b) S=23.1248;(c) S=19.0502;(d) S=14.9255;(e) S=20.1074;(f) S=13.2125;(g) S=23.2592;(h) S=18.7957
Fig. 5. Remote sensing images with different texture complexity. (a) S=9.2784; (b) S=23.1248; (c) S=19.0502; (d) S=14.9255; (e) S=20.1074; (f) S=13.2125; (g) S=23.2592; (h) S=18.7957
下载图片 查看原文
图 6. 由QuickBird-2卫星获取的幅遥感图像。(a)海港;(b)植被;(c)道路;(d)建筑群
Fig. 6. Remote sensing images acquired by QuickBird-2 satellite. (a) Harbor; (b) vegetation; (c) road; (d) buildings
下载图片 查看原文
图 7. 所提算法的综合评价结果
Fig. 7. Overall assessment results by proposed method
下载图片 查看原文
图 8. 所提方法与SSIM、PSNR和FSIM的拟合散点图。(a) SSIM;(b) PSNR;(c) FSIM
Fig. 8. Fitting scatter plot between proposed method and SSIM, PSNR, FSIM. (a) SSIM; (b) PSNR; (c) FSIM
下载图片 查看原文
图 9. LIVEMD数据集中不同评价方法的DMOS拟合曲线图。(a) SSIM;(b)所提方法;(c) PSNR;(d) FSIM
Fig. 9. Fitting curves of DMOS for different assessment methods in LIVEMD dataset. (a) SSIM; (b) proposed method; (c) PSNR; (d) FSIM
下载图片 查看原文
表 1模糊等级
Table1. Blur level
| i | 1 | 2 | 3 | 4 | 5 |
|---|
| Bblur_i | 5 | 4 | 3 | 2 | 1 | | Blurintensity | 0 | 1 | 2 | 3 | 4 |
|
查看原文
表 2噪声等级
Table2. Noise level
| j | 1 | 2 | 3 | 4 | 5 |
|---|
| Nnoise_j | 5 | 4 | 3 | 2 | 1 | | Noiseintensity | 0 | 1 | 2 | 3 | 4 |
|
查看原文
表 3ITU-R质量和损伤度量表
Table3. ITU-R quality and impairment scales
| Five-grade scale | 5 | 4 | 3 | 2 | 1 |
|---|
| Quality | Excellent | Good | Fair | Poor | Bad | | Impairment | Imperceptible | Perceptible,but not annoying | Slightlyannoying | Annoying | Veryannoying |
|
查看原文
表 4不同方法的性能比较
Table4. Performance comparison of different methods
| Method | PLCC | RMSE | SROCC |
|---|
| SSIM | 0.8979 | 0.5631 | 0.8714 | | PSNR | 0.8450 | 0.6842 | 0.7713 | | FSIM | 0.8978 | 0.5602 | 0.8793 | | Proposed | 0.9004 | 0.5566 | 0.8962 |
|
查看原文
表 5LIVEMD数据集中不同方法的性能比较
Table5. Performance comparison of different methods in LIVEMD database
| Method | PLCC | RMSE | SROCC |
|---|
| SSIM | 0.7679 | 11.9487 | -0.6953 | | PSNR | 0.7757 | 11.7910 | -0.7088 | | FSIM | 0.8178 | 10.7358 | -0.8642 | | Proposed | 0.8968 | 8.2523 | -0.8664 |
|
查看原文
刘迪, 李迎春. 基于深度学习和人眼视觉系统的遥感图像质量评价[J]. 激光与光电子学进展, 2019, 56(6): 061101. Di Liu, Yingchun Li. Quality Assessment of Remote Sensing Images Based on Deep Learning and Human Visual System[J]. Laser & Optoelectronics Progress, 2019, 56(6): 061101.


 PDF全文
PDF全文

